Quantcast
Channel: Severalnines - MariaDB
Viewing all 365 articles
Browse latest View live

Updated: ClusterControl Tips & Tricks - Transparent Database Failover for your Applications

$
0
0

ClusterControl is a great tool to deploy and manage databases clusters - if you are into MySQL, you can easily deploy clusters based on both traditional MySQL master-slave replication, Galera Cluster or MySQL NDB Cluster. To achieve high availability, deploying a cluster is not enough though. Nodes may (and will most probably) go down, and your system has to be able to adapt to those changes.

This adaptation can happen at different levels. You can implement some kind of logic within the application - it would check the state of cluster nodes and direct traffic to the ones which are reachable at the given moment. You can also build a proxy layer which will implement high availability in your system. In this blog post, we’d like to share some tips on how you can achieve that using ClusterControl.

Deploying HAProxy using the ClusterControl

HAProxy is the standard - one of the most popular proxies used in connection with MySQL (but not only, of course). ClusterControl supports deployment and monitoring of HAProxy nodes. It also helps to implement high availability of the proxy itself using keepalived.

Deployment is pretty simple - you need to pick or fill in the IP address of a host where HAProxy will be installed, pick port, load balancing policy, decide if ClusterControl should use existing repository or the most recent source code to deploy HAProxy. You can also pick which backend nodes you’d like to have included in the proxy configuration, and whether they should be active or backup.

By default, the HAProxy instance deployed by ClusterControl will work on MySQL Cluster (NDB), Galera Cluster, PostgreSQL streaming replication and MySQL Replication. For master-slave replication, ClusterControl can configure two listeners, one for read-only and another one for read-write. Applications will then have to send reads and writes to the respective ports. For multi-master replication, ClusterControl will setup the standard  TCP load-balancing based on least connection balancing algorithm (e.g., for Galera Cluster where all nodes are writeable).

Keepalived is used to add high availability to the proxy layer. When you have at least two HAProxy nodes in your system, you can install Keepalived from the ClusterControl UI.

You’ll have to pick two HAProxy nodes and they will be configured as an active - standby pair. A Virtual IP would be assigned to the active server and, should it fail, it will be reassigned to the standby proxy. This way you can just connect to the VIP and all your queries will be routed to the currently active and working HAProxy node.

You can find more details in how the internals are configured by reading through our HAProxy tutorial.

Deploying ProxySQL using ClusterControl

While HAProxy is a rock-solid proxy and very popular choice, it lacks database awareness, e.g., read-write split. The only way to do it in HAProxy is to create two backends and listen on two ports - one for reads and one for writes. This is, usually, fine but it requires you to implement changes in your application - the application has to understand what is a read and what is a write, and then direct those queries to the correct port. It’d be much easier to just connect to a single port and let the proxy decide what to do next - this is something HAProxy cannot do as what it does is just routing packets - no packet inspection is done and, especially, it has no understanding of the MySQL protocol.

ProxySQL solves this problem - it talks MySQL protocol and it can (among other things) perform a read-write split through its powerful query rules and route the incoming MySQL traffic according to various criterias. Installation of MaxScale from ClusterControl is simple - you want to go to Manage -> Load Balancer section and fill the “Deploy ProxySQL” tab with the required data.

In short, we need to pick where ProxySQL will be installed, what administration user and password it should have, which monitoring user it should use to connect to the  MySQL backends and verify their status and monitor state. From ClusterControl, you can either create a new user to be used by the application - you can decide on its name, password, access to which databases are granted and what MySQL privileges that user will have. Such user will be created on both MySQL and ProxySQL side. Second option, more suitable for existing infrastructures, is to use the existing database users. You need to pass username and password, and such user will be created only on ProxySQL.

Finally, you need to answer a question: are you using implicit transactions? By that we understand transactions started by running SET autocommit=0; If you do use it, ClusterControl will configure ProxySQL to send all of the traffic to the master. This is required to ensure ProxySQL will handle transactions correctly in ProxySQL 1.3.x and earlier. If you don’t use SET autocommit=0 to create new transaction, ClusterControl will configure read/write split.

ProxySQL, as every proxy, can become a single point of failure and it has to be made redundant to achieve high availability. There are a couple of methods to do that. One of them is to collocate ProxySQL on the web nodes. The idea here is that, most of the time, the ProxySQL process will work just fine and the reason for its unavailability is that the whole node went down. In such case, if ProxySQL is collocated with the web node, not much harm has been done because that particular web node will not be available either.

Another method, is to use Keepalived in a similar way like we did in the case of HAProxy.

You can find more details in how the internals are configured by reading through our ProxySQL tutorial.


Updated: Become a ClusterControl DBA: Managing your Database Configurations

$
0
0

In the past five posts of the blog series, we covered deployment of clustering/replication (MySQL / Galera, MySQL Replication, MongoDB & PostgreSQL), management & monitoring of your existing databases and clusters, performance monitoring and health, how to make your setup highly available through HAProxy and MaxScale and in the last post, how to prepare yourself for disasters by scheduling backups.

Since ClusterControl 1.2.11, we made major enhancements to the database configuration manager. The new version allows changing of parameters on multiple database hosts at the same time and, if possible, changing their values at runtime.

We featured the new MySQL Configuration Management in a Tips & Tricks blog post, but this blog post will go more in depth and cover Configuration Management within ClusterControl for MySQL, PostgreSQL and MongoDB.

ClusterControl Configuration management

The configuration management interface can be found under Manage > Configurations. From here, you can view or change the configurations of your database nodes and other tools that ClusterControl manages. ClusterControl will import the latest configuration from all nodes and overwrite previous copies made. Currently there is no historical data kept.

If you’d rather like to manually edit the config files directly on the nodes, you can re-import the altered configuration by pressing the Import button.

And last but not least: you can create or edit configuration templates. These templates are used whenever you deploy new nodes in your cluster. Of course any changes made to the templates will not retroactively applied to the already deployed nodes that were created using these templates.

MySQL Configuration Management

As previously mentioned, the MySQL configuration management got a complete overhaul in ClusterControl 1.2.11. The interface is now more intuitive. When changing the parameters ClusterControl checks whether the parameter actually exists. This ensures your configuration will not deny startup of MySQL due to parameters that don’t exist.

From Manage -> Configurations, you will find an overview of all config files used within the selected cluster, including load balancer nodes.

We use a tree structure to easily view hosts and their respective configuration files. At the bottom of the tree, you will find the configuration templates available for this cluster.

Changing parameters

Suppose we need to change a simple parameter like the maximum number of allowed connections (max_connections), we can simply change this parameter at runtime.

First select the hosts to apply this change to.

Then select the section you want to change. In most cases, you will want to change the MYSQLD section. If you would like to change the default character set for MySQL, you will have to change that in both MYSQLD and client sections.

If necessary you can also create a new section by simply typing the new section name. This will create a new section in the my.cnf.

Once we change a parameter and set its new value by pressing “Proceed”, ClusterControl will check if the parameter exists for this version of MySQL. This is to prevent any non-existent parameters to block the initialization of MySQL on the next restart.

When we press “proceed” for the max_connections change, we will receive a confirmation that it has been applied to the configuration and set at runtime using SET GLOBAL. A restart is not required as max_connections is a parameter we can change at runtime.

Now suppose we want to change the bufferpool size, this would require a restart of MySQL before it takes effect:

And as expected the value has been changed in the configuration file, but a restart is required. You can do this by logging into the host manually and restarting the MySQL process. Another way to do this from ClusterControl is by using the Nodes dashboard.

Restarting nodes in a Galera cluster

You can perform a restart per node by selecting “Restart Node” and pressing the “Proceed” button.

When you select “Initial Start” on a Galera node, ClusterControl will empty the MySQL data directory and force a full copy this way. This is, obviously, unnecessary for a configuration change. Make sure you leave the “initial” checkbox unchecked in the confirmation dialog. This will stop and start MySQL on the host but depending on your workload and bufferpool size this could take a while as MySQL will start flushing the dirty pages from the InnoDB bufferpool to disk. These are the pages that have been modified in memory but not on disk.

Restarting nodes in a MySQL master-slave topologies

For MySQL master-slave topologies you can’t just restart node by node. Unless downtime of the master is acceptable, you will have to apply the configuration changes to the slaves first and then promote a slave to become the new master.

You can go through the slaves one by one and execute a “Restart Node” on them.

After applying the changes to all slaves, promote a slave to become the new master:

After the slave has become the new master, you can shutdown and restart the old master node to apply the change.

Importing configurations

Now that we have applied the change directly on the database, as well as the configuration file, it will take until the next configuration import to see the change reflected in the configuration stored in ClusterControl. If you are less patient, you can schedule an immediate configuration import by pressing the “Import” button.

PostgreSQL Configuration Management

For PostgreSQL, the Configuration Management works a bit different from the MySQL Configuration Management. In general, you have the same functionality here: change the configuration, import configurations for all nodes and define/alter templates.

The difference here is that you can immediately change the whole configuration file and write this configuration back to the database node.

If the changes made requires a restart, a “Restart” button will appear that allows you to restart the node to apply the changes.

MongoDB Configuration Management

The MongoDB Configuration Management works similar to the MySQL Configuration Management: you can change the configuration, import configurations for all nodes, change parameters and alter templates.

Changing the configuration is pretty straightforward, by using Change Parameter dialog (as described in the "Changing Parameters" section::

Once changed, you can see the post-modification action proposed by ClusterControl in the "Config Change Log" dialog:

You can then proceed to restart the respective MongoDB nodes, one node at a time, to load the changes.

Final thoughts

In this blog post we learned about how to manage, alter and template your configurations in ClusterControl. Changing the templates can save you a lot of time when you have deployed only one node in your topology. As the template will be used for new nodes, this will save you from altering all configurations afterwards. However for MySQL and MongoDB based nodes, changing the configuration on all nodes has become trivial due to the new Configuration Management interface.

As a reminder, we recently covered in the same series deployment of clustering/replication (MySQL / Galera, MySQL Replication, MongoDB & PostgreSQL), management & monitoring of your existing databases and clusters, performance monitoring and health, how to make your setup highly available through HAProxy and MaxScale and in the last post, how to prepare yourself for disasters by scheduling backups.

Getting Started with ProxySQL - MySQL & MariaDB Load Balancing Tutorial

$
0
0

We’re excited to announce a major update to our tutorial “Database Load Balancing for MySQL and MariaDB with ProxySQL

ProxySQL is a lightweight yet complex protocol-aware proxy that sits between the MySQL clients and servers. It is a gate, which basically separates clients from databases, and is therefore an entry point used to access all the database servers.

In this new update we’ve…

  • Updated the information about how to best deploy ProxySQL via ClusterControl
  • Revamped the section “Getting Started with ProxySQL”
  • Added a new section on Data Masking
  • Added new frequently asked questions (FAQs)

Load balancing and high availability go hand-in-hand. ClusterControl makes it easy to deploy and configure several different load balancing technologies for MySQL and MariaDB with a point-and-click graphical interface, allowing you to easily try them out and see which ones work best for your unique needs.

ClusterControl
Single Console for Your Entire Database Infrastructure
Find out what else is new in ClusterControl

ClusterControl for ProxySQL

Included in ClusterControl Advanced and Enterprise, ProxySQL enables MySQL, MariaDB and Percona XtraDB database systems to easily manage intense, high-traffic database applications without losing availability. ClusterControl offers advanced, point-and-click configuration management features for the load balancing technologies we support. We know the issues regularly faced and make it easy to customize and configure the load balancer for your unique application needs.

We know load balancing and support many different technologies. ClusterControl has many things preconfigured to get you started with a couple of clicks. If you run into challenged we also provide resources and on-the-spot support to help ensure your configurations are running at peak performance.

ClusterControl delivers on an array of features to help deploy and manage ProxySQL

  • Advanced Graphical Interface - ClusterControl provides the only GUI on the market for the easy deployment, configuration and management of ProxySQL.
  • Point and Click deployment - With ClusterControl you’re able to apply point and click deployments to MySQL, MySQL replication, MySQL Cluster, Galera Cluster, MariaDB, MariaDB Galera Cluster, and Percona XtraDB technologies, as well the top related load balancers with HAProxy, MaxScale and ProxySQL.
  • Suite of monitoring graphs - With comprehensive reports you have a clear view of data points like connections, queries, data transfer and utilization, and more.
  • Configuration Management - Easily configure and manage your ProxySQL deployments with a simple UI. With ClusterControl you can create servers, re-orientate your setup, create users, set rules, manage query routing, and enable variable configurations.

Make sure to check out the update tutorial today!

Updated: Become a ClusterControl DBA: Making your DB components HA via Load Balancers

$
0
0

Choosing your HA topology

There are various ways to retain high availability with databases. You can use Virtual IPs (VRRP) to manage host availability, you can use resource managers like Zookeeper and Etcd to (re)configure your applications or use load balancers/proxies to distribute the workload over all available hosts.

The Virtual IPs need either an application to manage them (MHA, Orchestrator), some scripting (Keepalived, Pacemaker/Corosync) or an engineer to manually fail over and the decision making in the process can become complex. The Virtual IP failover is a straightforward and simple process by removing the IP address from one host, assigning it to another and use arping to send a gratuitous ARP response. In theory a Virtual IP can be moved in a second but it will take a few seconds before the failover management application is sure the host has failed and acts accordingly. In reality this should be somewhere between 10 and 30 seconds. Another limitation of Virtual IPs is that some cloud providers do not allow you to manage your own Virtual IPs or assign them at all. E.g., Google does not allow you to do that on their compute nodes.

Resource managers like Zookeeper and Etcd can monitor your databases and (re)configure your applications once a host fails or a slave gets promoted to master. In general this is a good idea but implementing your checks with Zookeeper and Etcd is a complex task.

A load balancer or proxy will sit in between the application and the database host and work transparently as if the client would connect to the database host directly. Just like with the Virtual IP and resource managers, the load balancers and proxies also need to monitor the hosts and redirect the traffic if one host is down. ClusterControl supports two proxies: HAProxy and ProxySQL and both are supported for MySQL master-slave replication and Galera cluster. HAProxy and ProxySQL both have their own use cases, we will describe them in this post as well.

Why do you need a load balancer?

In theory you don’t need a load balancer but in practice you will prefer one. We’ll explain why.

If you have virtual IPs setup, all you have to do is point your application to the correct (virtual) IP address and everything should be fine connection wise. But suppose you have scaled out the number of read replicas, you might want to provide virtual IPs for each of those read replicas as well because of maintenance or availability reasons. This might become a very large pool of virtual IPs that you have to manage. If one of those read replicas had a failure, you need to re-assign the virtual IP to another host or else your application will connect to either a host that is down or in worst case, a lagging server with stale data. Keeping the replication state to the application managing the virtual IPs is therefore necessary.

Also for Galera there is a similar challenge: you can in theory add as many hosts as you’d like to your application config and pick one at random. The same problem arises when this host is down: you might end up connecting to an unavailable host. Also using all hosts for both reads and writes might also cause rollbacks due to the optimistic locking in Galera. If two connections try to write to the same row at the same time, one of them will receive a roll back. In case your workload has such concurrent updates, it is advised to only use one node in Galera to write to. Therefore you want a manager that keeps track of the internal state of your database cluster.

Both HAProxy and ProxySQL will offer you the functionality to monitor the MySQL/MariaDB database hosts and keep state of your cluster and its topology. For replication setups, in case a slave replica is down, both HAProxy and ProxySQL can redistribute the connections to another host. But if a replication master is down, HAProxy will deny the connection and ProxySQL will give back a proper error to the client. For Galera setups, both load balancers can elect a master node from the Galera cluster and only send the write operations to that specific node.

On the surface HAProxy and ProxySQL may seem to be similar solutions, but they differ a lot in features and the way they distribute connections and queries. HAProxy supports a number of balancing algorithms like least connections, source, random and round-robin while ProxySQL distributes connections using the weight-based round-robin algorithm (equal weight means equal distribution). Since ProxySQL is an intelligent proxy, it is database aware and is also able to analyze your queries. ProxySQL is able to do read/write splitting based on query rules where you can forward the queries to the designated slaves or master in your cluster. ProxySQL includes additional functionality like query rewriting, caching and query firewall with real-time, in-depth statistics generation about the workload.

That should be enough background information on this topic, so let’s see how you can deploy both load balancers for MySQL replication and Galera topologies.

Deploying HAProxy

Using ClusterControl to deploy HAProxy on a Galera cluster is easy: go to the relevant cluster and select “Add Load Balancer”:

And you will be able to deploy an HAProxy instance by adding the host address and selecting the server instances you wish to include in the configuration:

By default the HAProxy instance will be configured to send connections to the server instances receiving the least number of connections, but you can change that policy to either round robin or source.

Under advanced settings you can set timeouts, maximum amount of connections and even secure the proxy by whitelisting an IP range for the connections.

Under the nodes tab of that cluster, the HAProxy node will appear:

Now your Galera cluster is also available via the newly deployed HAProxy node on port 3307. Don’t forget to GRANT your application access from the HAProxy IP, as now the traffic will be incoming from the proxy instead of the application hosts. Also, remember to point your application connection to the HAProxy node.

Now suppose the one server instance would go down, HAProxy will notice this within a few seconds and stop sending traffic to this instance:

The two other nodes are still fine and will keep receiving traffic. This retains the cluster highly available without the client even noticing the difference.

Deploying a secondary HAProxy node

Now that we have moved the responsibility of retaining high availability over the database connections from the client to HAProxy, what if the proxy node dies? The answer is to create another HAProxy instance and use a virtual IP controlled by Keepalived as shown in this diagram:

The benefit compared to using virtual IPs on the database nodes is that the logic for MySQL is at the proxy level and the failover for the proxies is simple.

So let’s deploy a secondary HAProxy node:

After we have deployed a secondary HAProxy node, we need to add Keepalived:

And after Keepalived has been added, your nodes overview will look like this:

So now instead of pointing your application connections to the HAProxy node directly you have to point them to the virtual IP instead.

In the example here, we used separate hosts to run HAProxy on, but you could easily add them to existing server instances as well. HAProxy does not bring much overhead, although you should keep in mind that in case of a server failure, you will lose both the database node and the proxy.

Deploying ProxySQL

Deploying ProxySQL to your cluster is done in a similar way to HAProxy: "Add Load Balancer" in the cluster list under ProxySQL tab.

In the deployment wizard, specify where ProxySQL will be installed, the administration user/password, the monitoring user/password to connect to the MySQL backends. From ClusterControl, you can either create a new user to be used by the application (the user will be created on both MySQL and ProxySQL) or use the existing database users (the user will be created on ProxySQL only). Set whether are you are using implicit transactions or not. Basically, if you don’t use SET autocommit=0 to create new transaction, ClusterControl will configure read/write split.

After ProxySQL has been deployed, it will be available under the Nodes tab:

Opening the ProxySQL node overview will present you the ProxySQL monitoring and management interface, so there is no reason to log into ProxySQL on the node anymore. ClusterControl covers most of the ProxySQL important stats like memory utilization, query cache, query processor and so on, as well as other metrics like hostgroups, backend servers, query rule hits, top queries and ProxySQL variables. In the ProxySQL management aspect, you can manage the query rules, backend servers, users, configuration and scheduler right from the UI.

Check out our ProxySQL tutorial page which covers extensively on how to perform database Load Balancing for MySQL and MariaDB with ProxySQL.

Deploying Garbd

Galera implements a quorum-based algorithm to select a primary component through which it enforces consistency. The primary component needs to have a majority of votes (50% + 1 node), so in a 2 node system, there would be no majority resulting in split brain. Fortunately, it is possible to add a garbd (Galera Arbitrator Daemon), which is a lightweight stateless daemon that can act as the odd node. The added benefit by adding the Galera Arbitrator is that you can now do with only two nodes in your cluster.

If ClusterControl detects that your Galera cluster consists of an even number of nodes, you will be given the warning/advice by ClusterControl to extend the cluster to an odd number of nodes:

Choose wisely the host to deploy garbd on, as it will receive all replicated data. Make sure the network can handle the traffic and is secure enough. You could choose one of the HAProxy or ProxySQL hosts to deploy garbd on, like in the example below:

Take note that starting from ClusterControl 1.5.1, garbd cannot be installed on the same host as ClusterControl due to risk of package conflicts.

After installing garbd, you will see it appear next to your two Galera nodes:

Final thoughts

We showed you how to make your MySQL master-slave and Galera cluster setups more robust and retain high availability using HAProxy and ProxySQL. Also garbd is a nice daemon that can save the extra third node in your Galera cluster.

This finalizes the deployment side of ClusterControl. In our next blog, we will show you how to integrate ClusterControl within your organization by using groups and assigning certain roles to users.

New Webinar: How to Measure Database Availability

$
0
0

Join us on April 24th for Part 2 of our database high availability webinar special!

In this session we will focus on how to measure database availability. It is notoriously hard to measure and report on, although it is an important KPI in any SLA between you and your customer. With that in mind, we will discuss the different factors that affect database availability and see how you can measure your database availability in a realistic way.

It is common enough to define availability in terms of 9s (e.g. 99.9% or 99.999%) - especially here at Severalnines - although there are often different opinions as to what these numbers actually mean, or how they are measured.

Is the database available if an instance is up and running, but it is unable to serve any requests? Or if response times are excessively long, so that users consider the service unusable? Is the impact of one longer outage the same as multiple shorter outages? How do partial outages affect database availability, where some users are unable to use the service while others are completely unaffected?

Not agreeing on precise definitions with your customers might lead to dissatisfaction. The database team might be reporting that they have met their availability goals, while the customer is dissatisfied with the service.

Join us for this webinar during which we will discuss the different factors that affect database availability and see how to measure database availability in a realistic way.

Register for the webinar

Date, Time & Registration

Europe/MEA/APAC

Tuesday, April 24th at 09:00 BST / 10:00 CEST (Germany, France, Sweden)

Register Now

North America/LatAm

Tuesday, April 24th at 09:00 PDT (US) / 12:00 EDT (US)

Register Now

Agenda

  • Defining availability targets
    • Critical business functions
    • Customer needs
    • Duration and frequency of downtime
    • Planned vs unplanned downtime
    • SLA
  • Measuring the database availability
    • Failover/Switchover time
    • Recovery time
    • Upgrade time
    • Queries latency
    • Restoration time from backup
    • Service outage time
  • Instrumentation and tools to measure database availability:
    • Free & open-source tools
    • CC's Operational Report
    • Paid tools

Register for the webinar

Speaker

Bartlomiej Oles is a MySQL and Oracle DBA, with over 15 years experience in managing highly available production systems at IBM, Nordea Bank, Acxiom, Lufthansa, and other Fortune 500 companies. In the past five years, his focus has been on building and applying automation tools to manage multi-datacenter database environments.

Capacity Planning for MySQL and MariaDB - Dimensioning Storage Size

$
0
0

Server manufacturers and cloud providers offer different kinds of storage solutions to cater for your database needs. When buying a new server or choosing a cloud instance to run our database, we often ask ourselves - how much disk space should we allocate? As we will find out, the answer is not trivial as there are a number of aspects to consider. Disk space is something that has to be thought of upfront, because shrinking and expanding disk space can be a risky operation for a disk-based database.

In this blog post, we are going to look into how to initially size your storage space, and then plan for capacity to support the growth of your MySQL or MariaDB database.

How MySQL Utilizes Disk Space

MySQL stores data in files on the hard disk under a specific directory that has the system variable "datadir". The contents of the datadir will depend on the MySQL server version, and the loaded configuration parameters and server variables (e.g., general_log, slow_query_log, binary log).

The actual storage and retrieval information is dependent on the storage engines. For the MyISAM engine, a table's indexes are stored in the .MYI file, in the data directory, along with the .MYD and .frm files for the table. For InnoDB engine, the indexes are stored in the tablespace, along with the table. If innodb_file_per_table option is set, the indexes will be in the table's .ibd file along with the .frm file. For the memory engine, the data are stored in the memory (heap) while the structure is stored in the .frm file on disk. In the upcoming MySQL 8.0, the metadata files (.frm, .par, dp.opt) are removed with the introduction of the new data dictionary schema.

It's important to note that if you are using InnoDB shared tablespace for storing table data (innodb_file_per_table=OFF), your MySQL physical data size is expected to grow continuously even after you truncate or delete huge rows of data. The only way to reclaim the free space in this configuration is to export, delete the current databases and re-import them back via mysqldump. Thus, it's important to set innodb_file_per_table=ON if you are concerned about the disk space, so when truncating a table, the space can be reclaimed. Also, with this configuration, a huge DELETE operation won't free up the disk space unless OPTIMIZE TABLE is executed afterward.

MySQL stores each database in its own directory under the "datadir" path. In addition, log files and other related MySQL files like socket and PID files, by default, will be created under datadir as well. For performance and reliability reason, it is recommended to store MySQL log files on a separate disk or partition - especially the MySQL error log and binary logs.

Database Size Estimation

The basic way of estimating size is to find the growth ratio between two different points in time, and then multiply that with the current database size. Measuring your peak-hours database traffic for this purpose is not the best practice, and does not represent your database usage as a whole. Think about a batch operation or a stored procedure that runs at midnight, or once a week. Your database could potentially grow significantly in the morning, before possibly being shrunk by a housekeeping operation at midnight.

One possible way is to use our backups as the base element for this measurement. Physical backup like Percona Xtrabackup, MariaDB Backup and filesystem snapshot would produce a more accurate representation of your database size as compared to logical backup, since it contains the binary copy of the database and indexes. Logical backup like mysqldump only stores SQL statements that can be executed to reproduce the original database object definitions and table data. Nevertheless, you can still come out with a good growth ratio by comparing mysqldump backups.

We can use the following formula to estimate the database size:

Where,

  • Bn - Current week full backup size,
  • Bn-1 - Previous week full backup size,
  • Dbdata - Total database data size,
  • Dbindex - Total database index size,
  • 52 - Number of weeks in a year,
  • Y - Year.

The total database size (data and indexes) in MB can be calculated by using the following statements:

mysql> SELECT ROUND(SUM(data_length + index_length) / 1024 / 1024, 2) "DB Size in MB" FROM information_schema.tables;
+---------------+
| DB Size in MB |
+---------------+
|       2013.41 |
+---------------+

The above equation can be modified if you would like to use the monthly backups instead. Change the constant value of 52 to 12 (12 months in a year) and you are good to go.

Also, don't forget to account for innodb_log_file_size x 2, innodb_data_file_path and for Galera Cluster, add gcache.size value.

Binary Logs Size Estimation

Binary logs are generated by the MySQL master for replication and point-in-time recovery purposes. It is a set of log files that contain information about data modifications made on the MySQL server. The size of the binary logs depends on the number of write operations and the binary log format - STATEMENT, ROW or MIXED. Statement-based binary log are usually much smaller as compared to row-based binary log, because it only consists of the write statements while the row-based consists of modified rows information.

The best way to estimate the maximum disk usage of binary logs is to measure the binary log size for a day and multiply it with the expire_logs_days value (default is 0 - no automatic removal). It's important to set expire_logs_days so you can estimate the size correctly. By default, each binary log is capped around 1GB before MySQL rotates the binary log file. We can use a MySQL event to simply flush the binary log for the purpose of this estimation.

Firstly, make sure event_scheduler variable is enabled:

mysql> SET GLOBAL event_scheduler = ON;

Then, as a privileged user (with EVENT and RELOAD privileges), create the following event:

mysql> USE mysql;
mysql> CREATE EVENT flush_binlog
ON SCHEDULE EVERY 1 HOUR STARTS CURRENT_TIMESTAMP ENDS CURRENT_TIMESTAMP + INTERVAL 2 HOUR
COMMENT 'Flush binlogs per hour for the next 2 hours'
DO FLUSH BINARY LOGS;

For a write-intensive workload, you probably need to shorten down the interval to 30 minutes or 10 minutes before the binary log reaches 1GB maximum size, then round the output up to an hour. Then verify the status of the event by using the following statement and look at the LAST_EXECUTED column:

mysql> SELECT * FROM information_schema.events WHERE event_name='flush_binlog'\G
       ...
       LAST_EXECUTED: 2018-04-05 13:44:25
       ...

Then, take a look at the binary logs we have now:

mysql> SHOW BINARY LOGS;
+---------------+------------+
| Log_name      | File_size  |
+---------------+------------+
| binlog.000001 |        146 |
| binlog.000002 | 1073742058 |
| binlog.000003 | 1073742302 |
| binlog.000004 | 1070551371 |
| binlog.000005 | 1070254293 |
| binlog.000006 |  562350055 | <- hour #1
| binlog.000007 |  561754360 | <- hour #2
| binlog.000008 |  434015678 |
+---------------+------------+

We can then calculate the average of our binary logs growth which is around ~562 MB per hour during peak hours. Multiply this value with 24 hours and the expire_logs_days value:

mysql> SELECT (562 * 24 * @@expire_logs_days);
+---------------------------------+
| (562 * 24 * @@expire_logs_days) |
+---------------------------------+
|                           94416 |
+---------------------------------+

We will get 94416 MB which is around ~95 GB of disk space for our binary logs. Slave's relay logs are basically the same as the master's binary logs, except that they are stored on the slave side. Therefore, this calculation also applies to the slave relay logs.

Spindle Disk or Solid State?

There are two types of I/O operations on MySQL files:

  • Sequential I/O-oriented files:
    • InnoDB system tablespace (ibdata)
    • MySQL log files:
      • Binary logs (binlog.xxxx)
      • REDO logs (ib_logfile*)
      • General logs
      • Slow query logs
      • Error log
  • Random I/O-oriented files:
    • InnoDB file-per-table data file (*.ibd) with innodb_file_per_table=ON (default).

Consider placing random I/O-oriented files in a high throughput disk subsystem for best performance. This could be flash drive - either SSDs or NVRAM card, or high RPM spindle disks like SAS 15K or 10K, with hardware RAID controller and battery-backed unit. For sequential I/O-oriented files, storing on HDD with battery-backed write-cache should be good enough for MySQL. Take note that performance degradation is likely if the battery is dead.

We will cover this area (estimating disk throughput and file allocation) in a separate post.

Capacity Planning and Dimensioning

Capacity planning can help us build a production database server with enough resources to survive daily operations. We must also provision for unexpected needs, account for future storage and disk throughput needs. Thus, capacity planning is important to ensure the database has enough room to breath until the next hardware refresh cycle.

It's best to illustrate this with an example. Considering the following scenario:

  • Next hardware cycle: 3 years
  • Current database size: 2013 MB
  • Current full backup size (week N): 1177 MB
  • Previous full backup size (week N-1): 936 MB
  • Delta size: 241MB per week
  • Delta ratio: 25.7% increment per week
  • Total weeks in 3 years: 156 weeks
  • Total database size estimation: ((1177 - 936) x 2013 x 156)/936 = 80856 MB ~ 81 GB after 3 years

If you are using binary logs, sum it up from the value we got in the previous section:

  • 81 + 95 = 176 GB of storage for database and binary logs.

Add at least 100% more room for operational and maintenance tasks (local backup, data staging, error log, operating system files, etc):

  • 176 + 176 = 352 GB of total disk space.

Based on this estimation, we can conclude that we would need at least 352 GB of disk space for our database for 3 years. You can use this value to justify your new hardware purchase. For example, if you want to buy a new dedicated server, you could opt for 6 x 128 SSD RAID 10 with battery-backed RAID controller which will give you around 384 GB of total disk space. Or, if you prefer cloud, you could get 100GB of block storage with provisioned IOPS for our 81GB database usage and use the standard persistent block storage for our 95GB binary logs and other operational usage.

Happy dimensioning!

How to Make Your MySQL or MariaDB Database Highly Available on AWS and Google Cloud

$
0
0

Running databases on cloud infrastructure is getting increasingly popular these days. Although a cloud VM may not be as reliable as an enterprise-grade server, the main cloud providers offer a variety of tools to increase service availability. In this blog post, we’ll show you how to architect your MySQL or MariaDB database for high availability, in the cloud. We will be looking specifically at Amazon Web Services and Google Cloud Platform, but most of the tips can be used with other cloud providers too.

Both AWS and Google offer database services on their clouds, and these services can be configured for high availability. It is possible to have copies in different availability zones (or zones in GCP), in order to increase your chances to survive partial failure of services within a region. Although a hosted service is a very convenient way of running a database, note that the service is designed to behave in a specific way and that may or may not fit your requirements. So for instance, AWS RDS for MySQL has a pretty limited list of options when it comes to failover handling. Multi-AZ deployments come with 60-120 seconds failover time as per the documentation. In fact, given the “shadow” MySQL instance has to start from a “corrupted” dataset, this may take even longer as more work could be required on applying or rolling back transactions from InnoDB redo logs. There is an option to promote a slave to become a master, but it is not feasible as you cannot reslave existing slaves off the new master. In the case of a managed service, it is also intrinsically more complex and harder to trace performance problems. More insights on RDS for MySQL and its limitations in this blog post.

On the other hand, if you decide to manage the databases, you are in a different world of possibilities. A number of things that you can do on bare metal are also possible on EC2 or Compute Engine instances. You do not have the overhead of managing the underlying hardware, and yet retain control on how to architect the system. There are two main options when designing for MySQL availability - MySQL replication and Galera Cluster. Let’s discuss them.

MySQL Replication

MySQL replication is a common way of scaling MySQL with multiple copies of the data. Asynchronous or semi-synchronous, it allows to propagate changes executed on a single writer, the master, to replicas/slaves - each of which would contain the full data set and can be promoted to become the new master. Replication can also be used for scaling reads, by directing read traffic to replicas and offloading the master in this way. The main advantage of replication is the ease of use - it is so widely known and popular (it’s also easy to configure) that there are numerous resources and tools to help you manage and configure it. Our own ClusterControl is one of them - you can use it to easily deploy a MySQL replication setup with integrated load balancers, manage topology changes, failover/recovery, and so on.

One major issue with MySQL replication is that it is not designed to handle network splits or master’s failure. If a master goes down, you have to promote one of the replicas. This is a manual process, although it can be automated with external tools (e.g. ClusterControl). There is also no quorum mechanism and there is no support for fencing of failed master instances in MySQL replication. Unfortunately, this may lead to serious issues in distributed environments - if you promoted a new master while your old one comes back online, you may end up writing to two nodes, creating data drift and causing serious data consistency issues.

We’ll look into some examples later in this post, that shows you how to detect network splits and implement STONITH or some other fencing mechanism for your MySQL replication setup.

Galera Cluster

We saw in the previous section that MySQL replication lacks fencing and quorum support - this is where Galera Cluster shines. It has a quorum support built-in, it also has a fencing mechanism which prevents partitioned nodes from accepting writes. This makes Galera Cluster more suitable than replication in multi-datacenter setups. Galera Cluster also supports multiple writers, and is able to resolve write conflicts. You are therefore not limited to a single writer in a multi-datacenter setup, it is possible to have a writer in every datacenter which reduces the latency between your application and database tier. It does not speed up writes as every write still has to be sent to every Galera node for certification, but it’s still easier than to send writes from all application servers across WAN to one single remote master.

As good as Galera is, it is not always the best choice for all workloads. Galera is not a drop-in replacement for MySQL/InnoDB. It shares common features with “normal” MySQL -  it uses InnoDB as storage engine, it contains the entire dataset on every node, which makes JOINs feasible. Still, some of the performance characteristics of Galera (like the performance of writes which are affected by network latency) differ from what you’d expect from replication setups. Maintenance looks different too: schema change handling works slightly different. Some schema designs are not optimal: if you have hotspots in your tables, like frequently updated counters, this may lead to performance issues. There is also a difference in best practices related to batch processing - instead of executing queries in large transactions, you want your transactions to be small.

Proxy tier

It is very hard and cumbersome to build a highly available setup without proxies. Sure, you can write code in your application to keep track of database instances, blacklist unhealthy ones, keep track of the writeable master(s), and so on. But this is much more complex than just sending traffic to a single endpoint - which is where a proxy comes in. ClusterControl allows you to deploy ProxySQL, HAProxy and MaxScale. We will give some examples using ProxySQL, as it gives us good flexibility in controlling database traffic.

ProxySQL can be deployed in a couple of ways. For starters, it can be deployed on separate hosts and Keepalived can be used to provide Virtual IP. The Virtual IP will be moved around should one of the ProxySQL instances fail. In the cloud, this setup can be problematic as adding an IP to the interface usually is not enough. You would have to modify Keepalived configuration and scripts to work with elastic IP (or static -however it might be called by your cloud provider). Then one would use cloud API or CLI to relocate this IP address to another host. For this reason, we’d suggest to collocate ProxySQL with the application. Each application server would be configured to connect to the local ProxySQL, using Unix sockets. As ProxySQL uses an angel process, ProxySQL crashes can be detected/restarted within a second. In case of hardware crash, that particular application server will go down along with ProxySQL. The remaining application servers can still access their respective local ProxySQL instances. This particular setup has additional features. Security - ProxySQL, as of version 1.4.8, does not have support for client-side SSL. It can only setup SSL connection between ProxySQL and the backend. Collocating ProxySQL on the application host and using Unix sockets is a good workaround. ProxySQL also has the ability to cache queries and if you are going to use this feature, it makes sense to keep it as close to the application as possible to reduce latency. We would suggest to use this pattern to deploy ProxySQL.

Typical setups

Let’s take a look at examples of highly available setups.

Single datacenter, MySQL replication

The assumption here is that there are two separate zones within the datacenter. Each zone has redundant and separate power, networking and connectivity to reduce the likelihood of two zones failing simultaneously. It is possible to set up a replication topology spanning both zones.

Here we use ClusterControl to manage the failover. To solve the split-brain scenario between availability zones, we collocate the active ClusterControl with the master. We also blacklist slaves in the other availability zone to make sure that automated failover won’t result in two masters being available.

Multiple datacenters, MySQL replication

In this example we use three datacenters and Orchestrator/Raft for quorum calculation. You might have to write your own scripts to implement STONITH if master is in the partitioned segment of the infrastructure. ClusterControl is used for node recovery and management functions.

Multiple datacenters, Galera Cluster

In this case we use three datacenters with a Galera arbitrator in the third one - this makes possible to handle whole datacenter failure and reduces a risk of network partitioning as the third datacenter can be used as a relay.

For further reading, take a look at the “How to Design Highly Available Open Source Database Environments” whitepaper and watch the webinar replay “Designing Open Source Databases for High Availability”.

How to do Point-in-Time Recovery of MySQL & MariaDB Data using ClusterControl

$
0
0

Backups are crucial when it comes to safety of data. They are the ultimate disaster recovery solution - you have no database nodes reachable and your datacenter could literally have gone up in smoke, but as long as you have a backup of your data, you can still recover from such situation.

Typically, you will use backups to recover from different types of cases:

  • accidental DROP TABLE or DELETE without a WHERE clause, or with a WHERE clause that was not specific enough.
  • a database upgrade that fails and corrupts the data
  • storage media failure/corruption

Is restoring from backup not enough? What does it have to be point-in-time? We have to keep in mind that a backup is a snapshot of data taken at a given point in time. If you take a backup at 1:00 am and a table was removed accidently at 11:00 am, you can restore your data up to 1:00 am but what about changes which happened between 1:00 am and 11:00 am? Those changes would be lost unless you can replay modifications that happened in between. Luckily, MySQL has such a mechanism for storing changes - binary logs. You may know those logs are used for replication - MySQL uses them to store all of the changes which happened on the master, and a slave uses them to replay those changes and apply them to its dataset. As the binlogs store all of the changes, you can also use them to replay traffic. In this blog post, we will take a look at how ClusterControl can help you perform Point-In-Time Recovery (PITR).

Creating backup compatible with Point-In-Time Recovery

First of all, let’s talk about prerequisites. A host where you take backups from has to have binary logs enabled. Without them, PITR is not possible. Second requirement - a host where you take backups from should have all the binary logs required in order to restore to a given point in time. If you use too aggressive binary log rotation, this could become a problem.

So, let us see how to use this feature in ClusterControl. First of all, you have to take a backup which is compatible with PITR. Such backup has to be full, complete and consistent. For xtrabackup, as long it contains full dataset (you didn’t include just a subset of schemas), it will be PITR-compatible.

For mysqldump, there is an option to make it PITR-compatible. When you enable this option, all necessary options will be configured (for example, you won’t be able to pick separate schemas to include in the dump) and backup will be marked as available for point-in-time recovery.

Point-In-Time Recovery from a backup

First, you have to pick a backup to restore.

If the backup is compatible with PITR, an option will be presented to perform a Point-In-Time Recovery. You will have two options for that - “Time Based” and “Position Based”. Let’s discuss the difference between those two options.

“Time Based” PITR

With this option you can pass a date and time, up to which the backup should be restored. It can be defined within one second resolution. It does not guarantee that all of the data will be restored because, even if you are very precise in defining the time, during one second multiple events could be recorded in the binary log. Let’s say that you know that the data loss happened on 18th of April, at 10:00:01. You pass the following date and time to the form: ‘2018-04-18 10:00:00’. Please keep in mind that you should be using a time that is based on the timezone settings on the database server on which the backup was created.

It still may happen that the data loss even wasn’t the first one which happened at 10:00:01 so some of the events will be lost in the process. Let’s look at what that means.

During one second, multiple events may be logged in binlogs. Let's consider such case:
10:00:00 - events A,B,C,D,E,F
10:00:01 - events V,W,X,Y,Z
where X is the data loss event. With a granularity of a second, you can either restore up to everything which happened at 10:00:00 (so up to F) or up to 10:00:01 (up to Z). The later case is of no use as X would be re-executed. In the former case, we miss V and W.

That's why position based restore is more precise. You can tell "I want to restore up to W".

Time based restore is the most precise you can get without having to go to the binary logs and define the exact position to where you want to restore. This leads us to the second method of doing PITR.

“Position Based” PITR

Here some experience with command line tools for MySQL, namely mysqlbinlog utility, is required. On the other hand, you will have the best control over how the recovery will be made.

Let’s go through a simple example. As you can see in the screenshot above, you will have to pass a binary log name and binary log position up to which point the backup should be restored. Most of the time, this should be the last position before the data loss event.

Someone executed a SQL command which resulted in a serious data loss:

mysql> DROP TABLE sbtest1;
Query OK, 0 rows affected (0.02 sec)

Our application immediately started to complain:

sysbench 1.1.0-ecf1191 (using bundled LuaJIT 2.1.0-beta3)

Running the test with following options:
Number of threads: 2
Report intermediate results every 1 second(s)
Initializing random number generator from current time


Initializing worker threads...

Threads started!

FATAL: mysql_drv_query() returned error 1146 (Table 'sbtest.sbtest1' doesn't exist) for query 'DELETE FROM sbtest1 WHERE id=5038'
FATAL: `thread_run' function failed: /usr/local/share/sysbench/oltp_common.lua:490: SQL error, errno = 1146, state = '42S02': Table 'sbtest.sbtest1' doesn't exist

We have a backup but we want to restore all of the data up to that fatal moment. First of all, we assume that the application does not work so we can discard all of the writes which happened after the DROP TABLE as non-important. If your application works to some extent, you would have to merge the remaining changes later on. Ok, let’s examine the binary logs to find the position of the DROP TABLE statement. As we want to avoid parsing all of the binary logs, let’s find what was the position our latest backup covered. You can check that by examining logs for the latest backup set and look for a line similar to this one:

So, we are talking about filename 'binlog.000008' and position '16184120'. Let’s use this as our starting point. Let’s check what binary log files we have:

root@vagrant:~# ls -alh /var/lib/mysql/binlog.*
-rw-r----- 1 mysql mysql  58M Apr 17 08:31 /var/lib/mysql/binlog.000001
-rw-r----- 1 mysql mysql 116M Apr 17 08:59 /var/lib/mysql/binlog.000002
-rw-r----- 1 mysql mysql 379M Apr 17 09:30 /var/lib/mysql/binlog.000003
-rw-r----- 1 mysql mysql 344M Apr 17 10:54 /var/lib/mysql/binlog.000004
-rw-r----- 1 mysql mysql 892K Apr 17 10:56 /var/lib/mysql/binlog.000005
-rw-r----- 1 mysql mysql  74M Apr 17 11:03 /var/lib/mysql/binlog.000006
-rw-r----- 1 mysql mysql 5.2M Apr 17 11:06 /var/lib/mysql/binlog.000007
-rw-r----- 1 mysql mysql  21M Apr 18 11:35 /var/lib/mysql/binlog.000008
-rw-r----- 1 mysql mysql  59K Apr 18 11:35 /var/lib/mysql/binlog.000009
-rw-r----- 1 mysql mysql  144 Apr 18 11:35 /var/lib/mysql/binlog.index

So, in addition to 'binlog.000008' we also have 'binlog.000009' to examine. Let’s run the command which will convert binary logs into SQL format starting from the position we found in the backup log:

root@vagrant:~# mysqlbinlog --start-position='16184120' --verbose /var/lib/mysql/binlog.000008 /var/lib/mysql/binlog.000009 > binlog.out

Please node ‘--verbose’ is required to decode row-based events. This is not necessarily required for the DROP TABLE we are looking for, but for other type of events it may be needed.

Let’s search our output for the DROP TABLE query:

root@vagrant:~# grep -B 7 -A 1 "DROP TABLE" binlog.out
# at 20885489
#180418 11:24:32 server id 1  end_log_pos 20885554 CRC32 0xb89f2e66     GTID    last_committed=38168    sequence_number=38170    rbr_only=no
SET @@SESSION.GTID_NEXT= '7fe29cb7-422f-11e8-b48d-0800274b240e:38170'/*!*/;
# at 20885554
#180418 11:24:32 server id 1  end_log_pos 20885678 CRC32 0xb38a427b     Query    thread_id=54    exec_time=0    error_code=0
use `sbtest`/*!*/;
SET TIMESTAMP=1524050672/*!*/;
DROP TABLE `sbtest1` /* generated by server */
/*!*/;

In this sample we can see two events. First, at the position of 20885489, sets GTID_NEXT variable.

# at 20885489
#180418 11:24:32 server id 1  end_log_pos 20885554 CRC32 0xb89f2e66     GTID    last_committed=38168    sequence_number=38170    rbr_only=no
SET @@SESSION.GTID_NEXT= '7fe29cb7-422f-11e8-b48d-0800274b240e:38170'/*!*/;

Second, at the position of 20885554 is our DROP TABLE event. This leads to the conclusion that we should perform the PITR up to the position of 20885489. The only question to answer is which binary log we are talking about. We can check that by searching for binlog rotation entries:

root@vagrant:~# grep  "Rotate to binlog" binlog.out
#180418 11:35:46 server id 1  end_log_pos 21013114 CRC32 0x2772cc18     Rotate to binlog.000009  pos: 4

As it can be clearly seen by comparing dates, rotation to binlog.000009 happened later therefore we want to pass binlog.000008 as the binlog file in the form.

Next, we have to decide if we are going to restore the backup on the cluster or do we want to use external server to restore it. This second option could be useful if you want to restore just a subset of data. You can restore full physical backup on a separate host and then use mysqldump to dump the missing data and load it up on the production server.

Keep in mind that when you restore the backup on your cluster, you will have to rebuild nodes other than the one you recovered. In master - slave scenario you will typically want to restore backup on the master and then rebuild slaves from it.

As a last step, you will see a summary of actions ClusterControl will take.

ClusterControl
Single Console for Your Entire Database Infrastructure
Find out what else is new in ClusterControl

Finally, after the backup was restored, we will test if the missing table has been restored or not:

mysql> show tables from sbtest like 'sbtest1'\G
*************************** 1. row ***************************
Tables_in_sbtest (sbtest1): sbtest1
1 row in set (0.00 sec)

Everything seems ok, we managed to restore missing data.

The last step we have to take is to rebuild our slave. Please note that there is an option to use a PITR backup. In the example here, this is not possible as the slave would replicate the DROP TABLE event and it would end up not being consistent with the master.


How to Overcome Accidental Data Deletion in MySQL & MariaDB

$
0
0

Someone accidently deleted part of the database. Someone forgot to include a WHERE clause in a DELETE query, or they dropped the wrong table. Things like that may and will happen, it is inevitable and human. But the impact can be disastrous. What can you do to guard yourself against such situations, and how can you recover your data? In this blog post, we will cover some of the most typical cases of the data loss, and how you can prepare yourself so you can recover from them.

Preparations

There are things you should do in order to ensure a smooth recovery. Let’s go through them. Please keep in mind that it’s not “pick one” situation - ideally you will implement all of the measures we are going to discuss below.

Backup

You have to have a backup, there is no getting away from it. You should have your backup files tested - unless you test your backups, you cannot be sure if they are any good and if you will ever be able to restore them. For disaster recovery you should keep a copy of your backup somewhere outside of your datacenter - just in case the whole datacenter becomes unavailable. To speed up the recovery, it’s very useful to keep a copy of the backup also on the database nodes. If your dataset is large, copying it over the network from a backup server to the database node which you want to restore may take significant time. Keeping the latest backup locally may significantly improve recovery times.

Logical Backup

Your first backup, most likely, will be a physical backup. For MySQL or MariaDB, it will be either something like xtrabackup or some sort of filesystem snapshot. Such backups are great for restoring a whole dataset or for provisioning new nodes. However, in case of deletion of a subset of data, they suffer from significant overhead. First of all, you are not able to restore all of the data, or else you will overwrite all changes that happened after the backup was created. What you are looking for is the ability to restore just a subset of data, only the rows which were accidentally removed. To do that with a physical backup, you would have to restore it on a separate host, locate removed rows, dump them and then restore them on the production cluster. Copying and restoring hundreds of gigabytes of data just to recover a handful of rows is something we would definitely call a significant overhead. To avoid it you can use logical backups - instead of storing physical data, such backups store data in a text format. This makes it easier to locate the exact data which was removed, which can then be restored directly on the production cluster. To make it even easier, you can also split such logical backup in parts and backup each and every table to a separate file. If your dataset is large, it will make sense to split one huge text file as much as possible. This will make the backup inconsistent but for the majority of the cases, this is no issue - if you will need to restore the whole dataset to a consistent state, you will use physical backup, which is much faster in this regard. If you need to restore just a subset of data, the requirements for consistency are less stringent.

Point-In-Time Recovery

Backup is just a beginning - you will be able to restore your data to the point at which the backup was taken but, most likely, data was removed after that time. Just by restoring missing data from the latest backup, you may lose any data that was changed after the backup. To avoid that you should implement Point-In-Time Recovery. For MySQL it basically means you will have to use binary logs to replay all the changes which happened between the moment of the backup and the data loss event. The below screenshot shows how ClusterControl can help with that.

What you will have to do is to restore this backup up to the moment just before the data loss. You will have to restore it on a separate host in order not to make changes on the production cluster. Once you have the backup restored, you can log into that host, find the missing data, dump it and restore on the production cluster.

Delayed Slave

All of the methods we discussed above have one common pain point - it takes time to restore the data. It may take longer, when you restore all of the data and then try to dump only the interesting part. It may take less time if you have logical backup and you can quickly drill down to the data you want to restore, but it is by no means a quick task. You still have to find a couple of rows in a large text file. The larger it is, the more complicated the task gets - sometimes the sheer size of the file slows down all actions. One method to avoid those problems is to have a delayed slave. Slaves typically try to stay up to date with the master but it is also possible to configure them so that they will keep a distance from their master. In the below screenshot, you can see how to use ClusterControl to deploy such a slave:

In short, we have here an option to add a replication slave to the database setup and configure it to be delayed. In the screenshot above, the slave will be delayed by 3600 seconds, which is one hour. This lets you to use that slave to recover the removed data up to one hour from the data deletion. You will not have to restore a backup, it will be enough to run mysqldump or SELECT ... INTO OUTFILE for the missing data and you will get the data to restore on your production cluster.

ClusterControl
Single Console for Your Entire Database Infrastructure
Find out what else is new in ClusterControl

Restoring Data

In this section, we will go through a couple of examples of accidental data deletion and how you can recover from them. We will walk through recovery from a full data loss, we will also show how to recover from a partial data loss when using physical and logical backups. We will finally show you how to restore accidentally deleted rows if you have a delayed slave in your setup.

Full Data Loss

Accidental “rm -rf” or “DROP SCHEMA myonlyschema;” has been executed and you ended up with no data at all. If you happened to also remove files other than from the MySQL data directory, you may need to reprovision the host. To keep things simpler we will assume that only MySQL has been impacted. Let’s consider two cases, with a delayed slave and without one.

No Delayed Slave

In this case the only thing thing we can do is to restore the last physical backup. As all of our data has been removed, we don’t need to be worried about activity which happened after the data loss because with no data, there is no activity. We should be worried about the activity which happened after the backup took place. This means we have to do a Point-in-Time restore. Of course, it will take longer than to just restore data from the backup. If bringing your database up quickly is more crucial than to have all of the data restored, you can as well just restore a backup and be fine with it.

First of all, if you still have access to binary logs on the server you want to restore, you can use them for PITR. First, we want to convert the relevant part of the binary logs to a text file for further investigation. We know that data loss happened after 13:00:00. First, let’s check which binlog file we should investigate:

root@vagrant:~# ls -alh /var/lib/mysql/binlog.*
-rw-r----- 1 mysql mysql 1.1G Apr 23 10:32 /var/lib/mysql/binlog.000001
-rw-r----- 1 mysql mysql 1.1G Apr 23 10:33 /var/lib/mysql/binlog.000002
-rw-r----- 1 mysql mysql 1.1G Apr 23 10:35 /var/lib/mysql/binlog.000003
-rw-r----- 1 mysql mysql 1.1G Apr 23 10:38 /var/lib/mysql/binlog.000004
-rw-r----- 1 mysql mysql 1.1G Apr 23 10:39 /var/lib/mysql/binlog.000005
-rw-r----- 1 mysql mysql 1.1G Apr 23 10:41 /var/lib/mysql/binlog.000006
-rw-r----- 1 mysql mysql 1.1G Apr 23 10:43 /var/lib/mysql/binlog.000007
-rw-r----- 1 mysql mysql 1.1G Apr 23 10:45 /var/lib/mysql/binlog.000008
-rw-r----- 1 mysql mysql 1.1G Apr 23 10:47 /var/lib/mysql/binlog.000009
-rw-r----- 1 mysql mysql 1.1G Apr 23 10:49 /var/lib/mysql/binlog.000010
-rw-r----- 1 mysql mysql 1.1G Apr 23 10:51 /var/lib/mysql/binlog.000011
-rw-r----- 1 mysql mysql 1.1G Apr 23 10:53 /var/lib/mysql/binlog.000012
-rw-r----- 1 mysql mysql 1.1G Apr 23 10:55 /var/lib/mysql/binlog.000013
-rw-r----- 1 mysql mysql 1.1G Apr 23 10:57 /var/lib/mysql/binlog.000014
-rw-r----- 1 mysql mysql 1.1G Apr 23 10:59 /var/lib/mysql/binlog.000015
-rw-r----- 1 mysql mysql 306M Apr 23 13:18 /var/lib/mysql/binlog.000016

As can be seen, we are interested in the last binlog file.

root@vagrant:~# mysqlbinlog --start-datetime='2018-04-23 13:00:00' --verbose /var/lib/mysql/binlog.000016 > sql.out

Once done, let’s take a look at the contents of this file. We will search for ‘drop schema’ in vim. Here’s a relevant part of the file:

# at 320358785
#180423 13:18:58 server id 1  end_log_pos 320358850 CRC32 0x0893ac86    GTID    last_committed=307804   sequence_number=307805  rbr_only=no
SET @@SESSION.GTID_NEXT= '52d08e9d-46d2-11e8-aa17-080027e8bf1b:443415'/*!*/;
# at 320358850
#180423 13:18:58 server id 1  end_log_pos 320358946 CRC32 0x487ab38e    Query   thread_id=55    exec_time=1     error_code=0
SET TIMESTAMP=1524489538/*!*/;
/*!\C utf8 *//*!*/;
SET @@session.character_set_client=33,@@session.collation_connection=33,@@session.collation_server=8/*!*/;
drop schema sbtest
/*!*/;

As we can see, we want to restore up to position 320358785. We can pass this data to the ClusterControl UI:

Delayed Slave

If we have a delayed slave and that host is enough to handle all of the traffic, we can use it and promote it to master. First though, we have to make sure it caught up with the old master up to the point of the data loss. We will use some CLI here to make it happen. First, we need to figure out on which position the data loss happened. Then we will stop the slave and let it run up to the data loss event. We showed how to get the correct position in the previous section - by examining binary logs. We can either use that position (binlog.000016, position 320358785) or, if we use a multithreaded slave, we should use GTID of the data loss event (52d08e9d-46d2-11e8-aa17-080027e8bf1b:443415) and replay queries up to that GTID.

First, let’s stop the slave and disable delay:

mysql> STOP SLAVE;
Query OK, 0 rows affected (0.01 sec)
mysql> CHANGE MASTER TO MASTER_DELAY = 0;
Query OK, 0 rows affected (0.02 sec)

Then we can start it up to a given binary log position.

mysql> START SLAVE UNTIL MASTER_LOG_FILE='binlog.000016', MASTER_LOG_POS=320358785;
Query OK, 0 rows affected (0.01 sec)

If we’d like to use GTID, the command will look different:

mysql> START SLAVE UNTIL SQL_BEFORE_GTIDS = ‘52d08e9d-46d2-11e8-aa17-080027e8bf1b:443415’;
Query OK, 0 rows affected (0.01 sec)

Once the replication stopped (meaning all of the events we asked for have been executed), we should verify that the host contains the missing data. If so, you can promote it to master and then rebuild other hosts using new master as the source of data.

This is not always the best option. All depends on how delayed your slave is - if it is delayed by a couple of hours, it may not make sense to wait for it to catch up, especially if write traffic is heavy in your environment. In such case, it’s most likely faster to rebuild hosts using physical backup. On the other hand, if you have a rather small volume of traffic, this could be a nice way to actually quickly fix the issue, promote new master and get on with serving traffic, while the rest of the nodes are being rebuilt in the background.

Partial Data Loss - Physical Backup

In case of the partial data loss, physical backups can be inefficient but, as those are the most common type of a backup, it’s very important to know how to use them for partial restore. First step will always be to restore a backup up to a point in time before the data loss event. It’s also very important to restore it on a separate host. ClusterControl uses xtrabackup for physical backups so we will show how to use it. Let’s assume we ran the following incorrect query:

DELETE FROM sbtest1 WHERE id < 23146;

We wanted to delete just a single row (‘=’ in WHERE clause), instead we deleted a bunch of them (< in WHERE clause). Let’s take a look at the binary logs to find at which position the issue happened. We will use that position to restore the backup to.

mysqlbinlog --verbose /var/lib/mysql/binlog.000003 > bin.out

Now, let’s look at the output file and see what we can find there. We are using row-based replication therefore we will not see the exact SQL that was executed. Instead (as long as we will use --verbose flag to mysqlbinlog) we will see events like below:

### DELETE FROM `sbtest`.`sbtest1`
### WHERE
###   @1=999296
###   @2=1009782
###   @3='96260841950-70557543083-97211136584-70982238821-52320653831-03705501677-77169427072-31113899105-45148058587-70555151875'
###   @4='84527471555-75554439500-82168020167-12926542460-82869925404'

As can be seen, MySQL identifies rows to delete using very precise WHERE condition. Mysterious signs in the human-readable comment, “@1”, “@2”, mean “first column”, “second column”. We know that the first column is ‘id’, which is something we are interested in. We need to find a large DELETE event on a ‘sbtest1’ table. Comments which will follow should mention id of 1, then id of ‘2’, then ‘3’ and so on - all up to id of ‘23145’. All should be executed in a single transaction (single event in a binary log). After analysing the output using ‘less’, we found:

### DELETE FROM `sbtest`.`sbtest1`
### WHERE
###   @1=1
###   @2=1006036
###   @3='123'
###   @4='43683718329-48150560094-43449649167-51455516141-06448225399'
### DELETE FROM `sbtest`.`sbtest1`
### WHERE
###   @1=2
###   @2=1008980
###   @3='123'
###   @4='05603373460-16140454933-50476449060-04937808333-32421752305'

The event, to which those comments are attached started at:

#180427  8:09:21 server id 1  end_log_pos 29600687 CRC32 0x8cfdd6ae     Xid = 307686
COMMIT/*!*/;
# at 29600687
#180427  8:09:21 server id 1  end_log_pos 29600752 CRC32 0xb5aa18ba     GTID    last_committed=42844    sequence_number=42845   rbr_only=yes
/*!50718 SET TRANSACTION ISOLATION LEVEL READ COMMITTED*//*!*/;
SET @@SESSION.GTID_NEXT= '0c695e13-4931-11e8-9f2f-080027e8bf1b:55893'/*!*/;
# at 29600752
#180427  8:09:21 server id 1  end_log_pos 29600826 CRC32 0xc7b71da5     Query   thread_id=44    exec_time=0     error_code=0
SET TIMESTAMP=1524816561/*!*/;
/*!\C utf8 *//*!*/;
SET @@session.character_set_client=33,@@session.collation_connection=33,@@session.collation_server=8/*!*/;
BEGIN
/*!*/;
# at 29600826

So, we want to restore the backup up to the previous commit at position 29600687. Let’s do that now. We’ll use external server for that. We will restore backup up to that position and we will keep the restore server up and running so we can then later extract the missing data.

Once restore is completed, let’s make sure our data has been recovered:

mysql> SELECT COUNT(*) FROM sbtest.sbtest1 WHERE id < 23146;
+----------+
| COUNT(*) |
+----------+
|    23145 |
+----------+
1 row in set (0.03 sec)

Looks good. Now we can extract this data into a file which we will load back on the master.

mysql> SELECT * FROM sbtest.sbtest1 WHERE id < 23146 INTO OUTFILE 'missing.sql';
ERROR 1290 (HY000): The MySQL server is running with the --secure-file-priv option so it cannot execute this statement

Something is not right - this is because the server is configured to be able to write files only in a particular location - it’s all about security, we don’t want to let users save contents anywhere they like. Let’s check where we can save our file:

mysql> SHOW VARIABLES LIKE "secure_file_priv";
+------------------+-----------------------+
| Variable_name    | Value                 |
+------------------+-----------------------+
| secure_file_priv | /var/lib/mysql-files/ |
+------------------+-----------------------+
1 row in set (0.13 sec)

Ok, let’s try one more time:

mysql> SELECT * FROM sbtest.sbtest1 WHERE id < 23146 INTO OUTFILE '/var/lib/mysql-files/missing.sql';
Query OK, 23145 rows affected (0.05 sec)

Now it looks much better. Let’s copy the data to the master:

root@vagrant:~# scp /var/lib/mysql-files/missing.sql 10.0.0.101:/var/lib/mysql-files/
missing.sql                                                                                                                                                                      100% 1744KB   1.7MB/s   00:00

Now it’s time to load the missing rows on the master and test if it succeeded:

mysql> LOAD DATA INFILE '/var/lib/mysql-files/missing.sql' INTO TABLE sbtest.sbtest1;
Query OK, 23145 rows affected (2.22 sec)
Records: 23145  Deleted: 0  Skipped: 0  Warnings: 0

mysql> SELECT COUNT(*) FROM sbtest.sbtest1 WHERE id < 23146;
+----------+
| COUNT(*) |
+----------+
|    23145 |
+----------+
1 row in set (0.00 sec)

That’s all, we restored our missing data.

Partial Data Loss - Logical Backup

In the previous section, we restored lost data using physical backup and an external server. What if we had logical backup created? Let’s take a look. First, let’s verify that we do have a logical backup:

root@vagrant:~# ls -alh /root/backups/BACKUP-13/
total 5.8G
drwx------ 2 root root 4.0K Apr 27 07:35 .
drwxr-x--- 5 root root 4.0K Apr 27 07:14 ..
-rw-r--r-- 1 root root 2.4K Apr 27 07:35 cmon_backup.metadata
-rw------- 1 root root 5.8G Apr 27 07:35 mysqldump_2018-04-27_071434_complete.sql.gz

Yes, it’s there. Now, it’s time to decompress it.

root@vagrant:~# mkdir /root/restore
root@vagrant:~# zcat /root/backups/BACKUP-13/mysqldump_2018-04-27_071434_complete.sql.gz > /root/restore/backup.sql

When you look into it, you will see that the data is stored in multi-value INSERT format. For example:

INSERT INTO `sbtest1` VALUES (1,1006036,'18034632456-32298647298-82351096178-60420120042-90070228681-93395382793-96740777141-18710455882-88896678134-41810932745','43683718329-48150560094-43449649167-51455516141-06448225399'),(2,1008980,'69708345057-48265944193-91002879830-11554672482-35576538285-03657113365-90301319612-18462263634-56608104414-27254248188','05603373460-16140454933-50476449060-04937808333-32421752305')

All we need to do now is to pinpoint where our table is located and then where the rows, which are of interest to us, are stored. First, knowing mysqldump patterns (drop table, create new one, disable indexes, insert data) let’s figure out which line contains CREATE TABLE statement for ‘sbtest1’ table:

root@vagrant:~/restore# grep -n "CREATE TABLE \`sbtest1\`" backup.sql > out
root@vagrant:~/restore# cat out
971:CREATE TABLE `sbtest1` (

Now, using a method of trial and error, we need to figure out where to look for our rows. We’ll show you the final command we came up with. The whole trick is to try and print different range of lines using sed and then check if the latest line contains rows close to, but later than what we are searching for. In the command below we look for lines between 971 (CREATE TABLE) and 993. We also ask sed to quit once it reaches line 994 as the rest of the file is of no interest to us:

root@vagrant:~/restore# sed -n '971,993p; 994q' backup.sql > 1.sql
root@vagrant:~/restore# tail -n 1 1.sql  | less

The output looks like below:

INSERT INTO `sbtest1` VALUES (31351,1007187,'23938390896-69688180281-37975364313-05234865797-89299459691-74476188805-03642252162-40036598389-45190639324-97494758464','60596247401-06173974673-08009930825-94560626453-54686757363'),

This means that our row range (up to row with id of 23145) is close. Next, it’s all about manual cleaning of the file. We want it to start with the first row we need to restore:

INSERT INTO `sbtest1` VALUES (1,1006036,'18034632456-32298647298-82351096178-60420120042-90070228681-93395382793-96740777141-18710455882-88896678134-41810932745','43683718329-48150560094-43449649167-51455516141-06448225399')

And end up with the last row to restore:

(23145,1001595,'37250617862-83193638873-99290491872-89366212365-12327992016-32030298805-08821519929-92162259650-88126148247-75122945670','60801103752-29862888956-47063830789-71811451101-27773551230');

We had to trim some of the unneeded data (it is multiline insert) but after all of this we have a file which we can load back on the master.

root@vagrant:~/restore# cat 1.sql | mysql -usbtest -psbtest -h10.0.0.101 sbtest
mysql: [Warning] Using a password on the command line interface can be insecure.

Finally, last check:

mysql> SELECT COUNT(*) FROM sbtest.sbtest1 WHERE id < 23146;
+----------+
| COUNT(*) |
+----------+
|    23145 |
+----------+
1 row in set (0.00 sec)

All is good, data has been restored.

Partial Data Loss, Delayed Slave

In this case, we will not go through the whole process. We already described how to identify the position of a data loss event in the binary logs. We also described how to stop a delayed slave and start the replication again, up to a point before the data loss event. We also explained how to use SELECT INTO OUTFILE and LOAD DATA INFILE to export data from external server and load it on the master. That’s all you need. As long as the data is still on the delayed slave, you have to stop it. Then you need to locate the position before the data loss event, start the slave up to that point and, once this is done, use the delayed slave to extract data which was deleted, copy the file to master and load it to restore the data.

Conclusion

Restoring lost data is not fun, but if you follow the steps we went through in this blog, you will have a good chance of recovering what you lost.

New Webinar on How to Migrate to Galera Cluster for MySQL & MariaDB

$
0
0

Join us on Tuesday May 29th for this new webinar with Severalnines Support Engineer Bart Oles, who will walk you through what you need to know in order to migrate from standalone or a master-slave MySQL/MariaDB setup to Galera Cluster.

When considering such a migration, plenty of questions typically come up, such as: how do we migrate? Does the schema or application change? What are the limitations? Can a migration be done online, without service interruption? What are the potential risks?

Galera Cluster has become a mainstream option for high availability MySQL and MariaDB. And though it is now known as a credible replacement for traditional MySQL master-slave architectures, it is not a drop-in replacement.

It has some characteristics that make it unsuitable for certain use cases, however, most applications can still be adapted to run on it.

The benefits are clear: multi-master InnoDB setup with built-in failover and read scalability.

Join us on May 29th for this walk-through on how to migrate to Galera Cluster for MySQL and MariaDB.

Sign up below!

Date, Time & Registration

Europe/MEA/APAC

Tuesday, May 29th at 09:00 BST / 10:00 CEST (Germany, France, Sweden)

Register Now

North America/LatAm

Tuesday, May 29th at 09:00 PDT (US) / 12:00 EDT (US)

Register Now

Agenda

  • Application use cases for Galera
  • Schema design
  • Events and Triggers
  • Query design
  • Migrating the schema
  • Load balancer and VIP
  • Loading initial data into the cluster
  • Limitations:
    • Cluster technology
    • Application vendor support
  • Performing Online Migration to Galera
  • Operational management checklist
  • Belts and suspenders: Plan B
  • Demo

Speaker

Bartlomiej Oles is a MySQL and Oracle DBA, with over 15 years experience in managing highly available production systems at IBM, Nordea Bank, Acxiom, Lufthansa, and other Fortune 500 companies. In the past five years, his focus has been on building and applying automation tools to manage multi-datacenter database environments.

We look forward to “seeing” you there and to insightful discussions!

Deploying Cloud Databases with ClusterControl 1.6

$
0
0

ClusterControl 1.6 comes with tighter integration with AWS, Azure and Google Cloud, so it is now possible to launch new instances and deploy MySQL, MariaDB, MongoDB and PostgreSQL directly from the ClusterControl user interface. In this blog, we will show you how to deploy a cluster on Amazon Web Services.

Note that this new feature requires two modules called clustercontrol-cloud and clustercontrol-clud. The former is a helper daemon which extends CMON capability of cloud communication, while the latter is a file manager client to upload and download files on cloud instances. Both packages are dependencies of the clustercontrol UI package, which will be installed automatically if they do not exist. See the Components documentation page for details.

Cloud Credentials

ClusterControl allows you to store and manage your cloud credentials under Integrations (side menu) -> Cloud Providers:

The supported cloud platforms in this release are Amazon Web Services, Google Cloud Platform and Microsoft Azure. On this page, you can add new cloud credentials, manage existing ones and also connect to your cloud platform to manage resources.

The credentials that have been set up here can be used to:

  • Manage cloud resources
  • Deploy databases in the cloud
  • Upload backup to cloud storage

The following is what you would see if you clicked on "Manage AWS" button:

You can perform simple management tasks on your cloud instances. You can also check the VPC settings under "AWS VPC" tab, as shown in the following screenshot:

The above features are useful as reference, especially when preparing your cloud instances before you start the database deployments.

Database Deployment on Cloud

In previous versions of ClusterControl, database deployment on cloud would be treated similarly to deployment on standard hosts, where you had to create the cloud instances beforehand and then supply the instance details and credentials in the "Deploy Database Cluster" wizard. The deployment procedure was unaware of any extra functionality and flexibility in the cloud environment, like dynamic IP and hostname allocation, NAT-ed public IP address, storage elasticity, virtual private cloud network configuration and so on.

With version 1.6, you just need to supply the cloud credentials, which can be managed via the "Cloud Providers" interface and follow the "Deploy in the Cloud" deployment wizard. From ClusterControl UI, click Deploy and you will be presented with the following options:

At the moment, the supported cloud providers are the three big players - Amazon Web Service (AWS), Google Cloud and Microsoft Azure. We are going to integrate more providers in the future release.

In the first page, you will be presented with the Cluster Details options:

In this section, you would need to select the supported cluster type, MySQL Galera Cluster, MongoDB Replica Set or PostgreSQL Streaming Replication. The next step is to choose the supported vendor for the selected cluster type. At the moment, the following vendors and versions are supported:

  • MySQL Galera Cluster - Percona XtraDB Cluster 5.7, MariaDB 10.2
  • MongoDB Cluster - MongoDB 3.4 by MongoDB, Inc and Percona Server for MongoDB 3.4 by Percona (replica set only).
  • PostgreSQL Cluster - PostgreSQL 10.0 (streaming replication only).

In the next step, you will be presented with the following dialog:

Here you can configure the selected cluster type accordingly. Pick the number of nodes. The Cluster Name will be used as the instance tag, so you can easily recognize this deployment in your cloud provider dashboard. No space is allowed in the cluster name. My.cnf Template is the template configuration file that ClusterControl will use to deploy the cluster. It must be located under /usr/share/cmon/templates on the ClusterControl host. The rest of the fields are pretty self-explanatory.

The next dialog is to select the cloud credentials:

You can choose the existing cloud credentials or create a new one by clicking on the "Add New Credential" button. The next step is to choose the virtual machine configuration:

Most of the settings in this step are dynamically populated from the cloud provider by the chosen credentials. You can configure the operating system, instance size, VPC setting, storage type and size and also specify the SSH key location on the ClusterControl host. You can also let ClusterControl generate a new key specifically for these instances. When clicking on "Add New" button next to Virtual Private Cloud, you will be presented with a form to create a new VPC:

VPC is a logical network infrastructure you have within your cloud platform. You can configure your VPC by modifying its IP address range, create subnets, configure route tables, network gateways, and security settings. It's recommended to deploy your database infrastructure in this network for isolation, security and routing control.

When creating a new VPC, specify the VPC name and IPv4 address block with subnet. Then, choose whether IPv6 should be part of the network and the tenancy option. You can then use this virtual network for your database infrastructure.

ClusterControl
Single Console for Your Entire Database Infrastructure
Find out what else is new in ClusterControl

The last step is the deployment summary:

In this stage, you need to choose which subnet under the chosen virtual network that you want the database to be running on. Take note that the chosen subnet MUST have auto-assign public IPv4 address enabled. You can also create a new subnet under this VPC by clicking on "Add New Subnet" button. Verify if everything is correct and hit the "Deploy Cluster" button to start the deployment.

You can then monitor the progress by clicking on the Activity -> Jobs -> Create Cluster -> Full Job Details:

Depending on the connections, it could take 10 to 20 minutes to complete. Once done, you will see a new database cluster listed under the ClusterControl dashboard. For PostgreSQL streaming replication cluster, you might need to know the master and slave IP addresses once the deployment completes. Simply go to Nodes tab and you would see the public and private IP addresses on the node list on the left:

Your database cluster is now deployed and running on AWS.

At the moment, the scaling up works similar to the standard host, where you need to create a cloud instance manually beforehand and specify the host under ClusterControl -> pick the cluster -> Add Node.

Under the hood, the deployment process does the following:

  1. Create cloud instances
  2. Configure security groups and networking
  3. Verify the SSH connectivity from ClusterControl to all created instances
  4. Deploy database on every instance
  5. Configure the clustering or replication links
  6. Register the deployment into ClusterControl

Take note that this feature is still in beta. Nevertheless, you can use this feature to speed up your development and testing environment by controlling and managing the database cluster in different cloud providers from a single user interface.

Database Backup on Cloud

This feature has been around since ClusterControl 1.5.0, and now we added support for Azure Cloud Storage. This means that you can now upload and download the created backup on all three major cloud providers (AWS, GCP and Azure). The upload process happens right after the backup is successfully created (if you toggle "Upload Backup to the Cloud") or you can manually click on the cloud icon button of the backup list:

You can then download and restore backups from the cloud, in case you lost your local backup storage, or if you need to reduce local disk space usage for your backups.

Current Limitations

There are some known limitations for the cloud deployment feature, as stated below:

  • There is currently no 'accounting' in place for the cloud instances. You will need to manually remove the cloud instances if you remove a database cluster.
  • You cannot add or remove a node automatically with cloud instances.
  • You cannot deploy a load balancer automatically with a cloud instance.

We have extensively tested the feature in many environments and setups but there are always corner cases that we might have missed out upon. For more information, please take a look at the change log.

Happy clustering in the cloud!

Updated: Become a ClusterControl DBA: Safeguarding your Data

$
0
0

In the past four posts of the blog series, we covered deployment of clustering/replication (MySQL/Galera, MySQL Replication, MongoDB & PostgreSQL), management & monitoring of your existing databases and clusters, performance monitoring and health and in the last post, how to make your setup highly available through HAProxy and ProxySQL.

So now that you have your databases up and running and highly available, how do you ensure that you have backups of your data?

You can use backups for multiple things: disaster recovery, to provide production data to test against development or even to provision a slave node. This last case is already covered by ClusterControl. When you add a new (replica) node to your replication setup, ClusterControl will make a backup/snapshot of the master node and use it to build the replica. It can also use an existing backup to stage the replica, in case you want to avoid that extra load on the master. After the backup has been extracted, prepared and the database is up and running, ClusterControl will automatically set up replication.

Creating an Instant Backup

In essence, creating a backup is the same for Galera, MySQL replication, PostgreSQL and MongoDB. You can find the backup section under ClusterControl > Backup and by default you would see a list of created backup of the cluster (if any). Otherwise, you would see a placeholder to create a backup:

From here you can click on the "Create Backup" button to make an instant backup or schedule a new backup:

All created backups can also be uploaded to cloud by toggling "Upload Backup to the Cloud", provided you supply working cloud credentials. By default, all backups older than 31 days will be deleted (configurable via Backup Retention settings) or you can choose to keep it forever or define a custom period.

"Create Backup" and "Schedule Backup" share similar options except the scheduling part and incremental backup options for the latter. Therefore, we are going to look into Create Backup feature (a.k.a instant backup) in more depth.

As all these various databases have different backup tools, there is obviously some difference in the options you can choose. For instance with MySQL you get to choose between mysqldump and xtrabackup (full and incremental). For MongoDB, ClusterControl supports mongodump and mongodb-consistent-backup (beta) while PostgreSQL, pg_dump and pg_basebackup are supported. If in doubt which one to choose for MySQL, check out this blog about the differences and use cases for mysqldump and xtrabackup.

Backing up MySQL and Galera

As mentioned in the previous paragraph, you can make MySQL backups using either mysqldump or xtrabackup (full or incremental). In the "Create Backup" wizard, you can choose which host you want to run the backup on, the location where you want to store the backup files, and its directory and specific schemas (xtrabackup) or schemas and tables (mysqldump).

If the node you are backing up is receiving (production) traffic, and you are afraid the extra disk writes will become intrusive, it is advised to send the backups to the ClusterControl host by choosing "Store on Controller" option. This will cause the backup to stream the files over the network to the ClusterControl host and you have to make sure there is enough space available on this node and the streaming port is opened on the ClusterControl host.

There are also several other options whether you would want to use compression and the compression level. The higher the compression level is, the smaller the backup size will be. However, it requires higher CPU usage for the compression and decompression process.

If you would choose xtrabackup as the method for the backup, it would open up extra options: desync, backup locks, compression and xtrabackup parallel threads/gzip. The desync option is only applicable to desync a node from a Galera cluster. Backup locks uses a new MDL lock type to block updates to non-transactional tables and DDL statements for all tables which is more efficient for InnoDB-specific workload. If you are running on Galera Cluster, enabling this option is recommended.

After scheduling an instant backup you can keep track of the progress of the backup job in the Activity > Jobs:

After it has finished, you should be able to see the a new entry under the backup list.

Backing up PostgreSQL

Similar to the instant backups of MySQL, you can run a backup on your Postgres database. With Postgres backups there are two backup methods supported - pg_dumpall or pg_basebackup. Take note that ClusterControl will always perform a full backup regardless of the chosen backup method.

We have covered this aspect in this details in Become a PostgreSQL DBA - Logical & Physical PostgreSQL Backups.

Backing up MongoDB

For MongoDB, ClusterControl supports the standard mongodump and mongodb-consistent-backup developed by Percona. The latter is still in beta version which provides cluster-consistent point-in-time backups of MongoDB suitable for sharded cluster setups. As the sharded MongoDB cluster consists of multiple replica sets, a config replica set and shard servers, it is very difficult to make a consistent backup using only mongodump.

Note that in the wizard, you don't have to pick a database node to be backed up. ClusterControl will automatically pick the healthiest secondary replica as the backup node. Otherwise, the primary will be selected. When the backup is running, the selected backup node will be locked until the backup process completes.

Scheduling Backups

Now that we have played around with creating instant backups, we now can extend that by scheduling the backups.

The scheduling is very easy to do: you can select on which days the backup has to be made and at what time it needs to run.

For xtrabackup there is an additional feature: incremental backups. An incremental backup will only backup the data that changed since the last backup. Of course, the incremental backups are useless if there would not be full backup as a starting point. Between two full backups, you can have as many incremental backups as you like. But restoring them will take longer.

Once scheduled the job(s) should become visible under the "Scheduled Backup" tab and you can edit them by clicking on the "Edit" button. Like with the instant backups, these jobs will schedule the creation of a backup and you can keep track of the progress via the Activity tab.

Backup List

You can find the Backup List under ClusterControl > Backup and this will give you a cluster level overview of all backups made. Clicking on each entry will expand the row and expose more information about the backup:

Each backup is accompanied with a backup log when ClusterControl executed the job, which is available under "More Actions" button.

Offsite Backup in Cloud

Since we have now a lot of backups stored on either the database hosts or the ClusterControl host, we also want to ensure they don’t get lost in case we face a total infrastructure outage. (e.g. DC on fire or flooded) Therefore ClusterControl allows you to store or copy your backups offsite on cloud. The supported cloud platforms are Amazon S3, Google Cloud Storage and Azure Cloud Storage.

The upload process happens right after the backup is successfully created (if you toggle "Upload Backup to the Cloud") or you can manually click on the cloud icon button of the backup list:

Choose the cloud credential and specify the backup location accordingly:

Restore and/or Verify Backup

From the Backup List interface, you can directly restore a backup to a host in the cluster by clicking on the "Restore" button for the particular backup or click on the "Restore Backup" button:

One nice feature is that it is able to restore a node or cluster using the full and incremental backups as it will keep track of the last full backup made and start the incremental backup from there. Then it will group a full backup together with all incremental backups till the next full backup. This allows you to restore starting from the full backup and applying the incremental backups on top of it.

ClusterControl supports restore on an existing database node or restore and verify on a new standalone host:

These two options are pretty similar, except the verify one has extra options for the new host information. If you follow the restoration wizard, you will need to specify a new host. If "Install Database Software" is enabled, ClusterControl will remove any existing MySQL installation on the target host and reinstall the database software with the same version as the existing MySQL server.

Once the backup is restored and verified, you will receive a notification on the restoration status and the node will be shut down automatically.

Point-in-Time Recovery

For MySQL, both xtrabackup and mysqldump can be used to perform point-in-time recovery and also to provision a new replication slave for master-slave replication or Galera Cluster. A mysqldump PITR-compatible backup contains one single dump file, with GTID info, binlog file and position. Thus, only the database node that produces binary log will have the "PITR compatible" option available:

When PITR compatible option is toggled, the database and table fields are greyed out since ClusterControl will always perform a full backup against all databases, events, triggers and routines of the target MySQL server.

Now restoring the backup. If the backup is compatible with PITR, an option will be presented to perform a Point-In-Time Recovery. You will have two options for that - “Time Based” and “Position Based”. For “Time Based”, you can just pass the day and time. For “Position Based”, you can pass the exact position to where you want to restore. It is a more precise way to restore, although you might need to get the binlog position using the mysqlbinlog utility. More details about point in time recovery can be found in this blog.

Backup Encryption

Universally, ClusterControl supports backup encryption for MySQL, MongoDB and PostgreSQL. Backups are encrypted at rest using AES-256 CBC algorithm. An auto generated key will be stored in the cluster's configuration file under /etc/cmon.d/cmon_X.cnf (where X is the cluster ID):

$ sudo grep backup_encryption_key /etc/cmon.d/cmon_1.cnf
backup_encryption_key='JevKc23MUIsiWLf2gJWq/IQ1BssGSM9wdVLb+gRGUv0='

If the backup destination is not local, the backup files are transferred in encrypted format. This feature complements the offsite backup on cloud, where we do not have full access to the underlying storage system.

Final Thoughts

We showed you how to get your data backed up and how to store them safely off site. Recovery is always a different thing. ClusterControl can recover automatically your databases from the backups made in the past that are stored on premises or copied back from the cloud.

Obviously there is more to securing your data, especially on the side of securing your connections. We will cover this in the next blog post!

Cloud Disaster Recovery for MariaDB and MySQL

$
0
0

MySQL has a long tradition in geographic replication. Distributing clusters to remote data centers reduces the effects of geographic latency by pushing data closer to the user. It also provides a capability for disaster recovery. Due to the significant cost of duplicating hardware in a separate site, not many companies were able to afford it in the past. Another cost is skilled staff who is able to design, implement and maintain a sophisticated multiple data centers environment.

With the Cloud and DevOps automation revolution, having distributed datacenter has never been more accessible to the masses. Cloud providers are increasing the range of services they offer for a better price.One can build cross-cloud, hybrid environments with data spread all over the world. One can make flexible and scalable DR plans to approach a broad range of disruption scenarios. In some cases, that can just be a backup stored offsite. In other cases, it can be a 1 to 1 copy of a production environment running somewhere else.

In this blog we will take a look at some of these cases, and address common scenarios.

Storing Backups in the Cloud

A DR plan is a general term that describes a process to recover disrupted IT systems and other critical assets an organization uses. Backup is the primary method to achieve this. When a backup is in the same data center as your production servers, you risk that all data may be wiped out in case you lose that data center. To avoid that, you should have the policy to create a copy in another physical location. It's still a good practice to keep a backup on disk to reduce the time needed to restore. In most cases, you will keep your primary backup in the same data center (to minimize restore time), but you should also have a backup that can be used to restore business procedures when primary datacenter is down.

ClusterControl: Upload Backup to the cloud

ClusterControl allows seamless integration between your database environment and the cloud. It provides options for migrating data to the cloud. We offer a full combination of database backups for Amazon Web Services (AWS), Google Cloud Services or Microsoft Azure. Backups can now be executed, scheduled, downloaded and restored directly from your cloud provider of choice. This ability provides increased redundancy, better disaster recovery options, and benefits in both performance and cost savings.

ClusterControl: Managing Cloud Credentials

The first step to set up "data center failure - proof backup" is to provide credentials for your cloud operator. You can choose from multiple vendors here. Let's take a look at the process set up for the most popular cloud operator - AWS.

ClusterControl: adding cloud credentials

All you need is the AWS Key ID and the secret for the region where you want to store your backup. You can get that from AWS console. You can follow a few steps to get it.

  1. Use your AWS account email address and password to sign in to the AWS Management Console as the AWS account root user.
  2. On the IAM Dashboard page, choose your account name in the navigation bar, and then select My Security Credentials.
  3. If you see a warning about accessing the security credentials for your AWS account, choose to Continue to Security Credentials.
  4. Expand the Access keys (access key ID and secret access key) section.
  5. Choose to Create New Access Key. Then choose Download Key File to save the access key ID and secret access key to a file on your computer. After you close the dialog box, you will not be able to retrieve this secret access key again.
ClusterControl: Hybrid cloud backup

When all is set, you can adjust your backup schedule and enable backup to cloud option. To reduce network traffic make sure to enable data compression. It makes backups smaller and minimizes the time needed for upload. Another good practice is to encrypt the backup. ClusterControl creates a key automatically and uses it if you decide to restore it. Advanced backup policies should have different keep times for backups stored on servers in the same datacenter, and the backups stored in another physical location. You should set a more extended retention period for cloud-based backups, and shorter period for backups stored near the production environment, as the probability of restore drops with the backup lifetime.

ClusterControl: backup retention policy

Extend your cluster with asynchronous replication

Galera with asynchronous replication can be an excellent solution to build an active DR node in a remote data center. There are a few good reasons to attach an asynchronous slave to a Galera Cluster. Long-running OLAP type queries on a Galera node might slow down a whole cluster. With delay apply option, delayed replication can save you from human errors so all those golden enters will be not immediately applied to your backup node.

ClusterControl: delayed replication

In ClusterControl, extending a Galera node group with asynchronous replication is done in a single page wizard. You need to provide the necessary information about your future or existing slave server. The slave will be set up from an existing backup, or a freshly streamed XtraBackup from the master to the slave.

Load balancers in multi-datacenter

Load balancers are a crucial component in MySQL and MariaDB database high availability. It’s not enough to have a cluster spanning across multiple data centers. You still need your services to access them. A failure of a load balancer that is available in one data center will make your entire environment unreachable.

Web proxies in cluster environment

One of the popular methods to hide the complexity of the database layer from an application is to use a proxy. Proxies act as an entry point to the databases, they track the state of the database nodes and should always direct traffic to only the nodes that are available. ClusterControl makes it easy to deploy and configure several different load balancing technologies for MySQL and MariaDB, including ProxySQL, HAProxy, with a point-and-click graphical interface.

ClusterControl: load balancer HA

It also allows making this component redundant by adding keepalived on top of it. To prevent your load balancers from being a single point of failure, one would set up two identical (one active and one in different DC as standby) HAProxy, ProxySQL or MariaDB Maxscale instances and use Keepalived to run Virtual Router Redundancy Protocol (VRRP) between them. VRRP provides a Virtual IP address to the active load balancer and transfers the Virtual IP to the standby HAProxy in case of failure. It is seamless because the two proxy instances need no shared state.

Of course, there are many things to consider to make your databases immune to data center failures.
Proper planning and automation will make it work! Happy Clustering!

How to Recover Galera Cluster or MySQL Replication from Split Brain Syndrome

$
0
0

You may have heard about the term “split brain”. What it is? How does it affect your clusters? In this blog post we will discuss what exactly it is, what danger it may pose to your database, how we can prevent it, and if everything goes wrong, how to recover from it.

Long gone are the days of single instances, nowadays almost all databases run in replication groups or clusters. This is great for high availability and scalability, but a distributed database introduces new dangers and limitations. One case which can be deadly is a network split. Imagine a cluster of multiple nodes which, due to network issues, was split in two parts. For obvious reasons (data consistency), both parts shouldn’t handle traffic at the same time as they are isolated from each other and data cannot be transferred between them. It is also wrong from the application point of view - even if, eventually, there would be a way to sync the data (although reconciliation of 2 datasets is not trivial). For a while, part of the application would be unaware of the changes made by other application hosts, which accesses the other part of the database cluster. This can lead to serious problems.

The condition in which the cluster has been divided in two or more parts that are willing to accept writes is called “split brain”.

The biggest problem with split brain is data drift, as writes happen on both parts of the cluster. None of MySQL flavors provide automated means of merging datasets that have diverged. You will not find such feature in MySQL replication, Group Replication or Galera. Once the data has diverged, the only option is to either use one of the parts of the cluster as the source of truth and discard changes executed on the other part - unless we can follow some manual process in order to merge the data.

This is why we will start with how to prevent split brain from happening. This is so much easier than having to fix any data discrepancy.

How to prevent split brain

The exact solution depends on the type of the database and the setup of the environment. We will take a look at some of the most common cases for Galera Cluster and MySQL Replication.

Galera cluster

Galera has a built-in “circuit breaker” to handle split brain: it rely on a quorum mechanism. If a majority (50% + 1) of the nodes are available in the cluster, Galera will operate normally. If there is no majority, Galera will stop serving traffic and switch to so called “non-Primary” state. This is pretty much all you need to deal with a split brain situation while using Galera. Sure, there are manual methods to force Galera into “Primary” state even if there’s not a majority. Thing is, unless you do that, you should be safe.

The way how quorum is calculated has important repercussions - at a single datacenter level, you want to have an odd number of nodes. Three nodes give you a tolerance for failure of one node (2 nodes match the requirement of more than 50% of the nodes in the cluster being available). Five nodes will give you a tolerance for failure of two nodes (5 - 2 = 3 which is more than 50% from 5 nodes). On the other hand, using four nodes will not improve your tolerance over three node cluster. It would still handle only a failure of one node (4 - 1 = 3, more than 50% from 4) while failure of two nodes will render the cluster unusable (4 - 2 = 2, just 50%, not more).

While deploying Galera cluster in a single datacenter, please keep in mind that, ideally, you would like to distribute nodes across multiple availability zones (separate power source, network, etc.) - as long as they do exist in your datacenter, that is. A simple setup may look like below:

At the multi-datacenter level, those considerations are also applicable. If you want Galera cluster to automatically handle datacenter failures, you should use an odd number of datacenters. To reduce costs, you can use a Galera arbitrator in one of them instead of a database node. Galera arbitrator (garbd) is a process which takes part in the quorum calculation but it does not contain any data. This makes it possible to use it even on very small instances as it is not resource-intensive - although the network connectivity has to be good as it ‘sees’ all the replication traffic. Example setup may look like on a diagram below:

MySQL Replication

With MySQL replication the biggest issue is that there is no quorum mechanism builtin, as it is in Galera cluster. Therefore more steps are required to ensure that your setup will not be affected by a split brain.

One method is to avoid cross-datacenter automated failovers. You can configure your failover solution (it can be through ClusterControl, or MHA or Orchestrator) to failover only within single datacenter. If there was a full datacenter outage, it would be up to the admin to decide how to failover and how to ensure that the servers in the failed datacenter will not be used.

There are options to make it more automated. You can use Consul to store data about the nodes in the replication setup, and which one of them is the master. Then it will be up to the admin (or via some scripting) to update this entry and move writes to the second datacenter. You can benefit from an Orchestrator/Raft setup where Orchestrator nodes can be distributed across multiple datacenters and detect split brain. Based on this you could take different actions like, as we mentioned previously, update entries in our Consul or etcd. The point is that this is a much more complex environment to setup and automate than Galera cluster. Below you can find example of multi-datacenter setup for MySQL replication.

Please keep in mind that you still have to create scripts to make it work, i.e. monitor Orchestrator nodes for a split brain and take necessary actions to implement STONITH and ensure that the master in datacenter A will not be used once the network converge and connectivity will be restored.

Split brain happened - what to do next?

The worst case scenario happened and we have data drift. We will try to give you some hints what can be done here. Unfortunately, the exact steps will depend mostly on your schema design so it will not be possible to write a precise how-to guide.

What you have to keep in mind is that the ultimate goal will be to copy data from one master to the other and recreate all relations between tables.

First of all, you have to identify which node will continue serving data as master. This is a dataset to which you will merge data stored on the other “master” instance. Once that’s done, you have to identify data from old master which is missing on the current master. This will be manual work. If you have timestamps in your tables, you can leverage them to pinpoint the missing data. Ultimately, binary logs will contain all data modifications so you can rely on them. You may also have to rely on your knowledge of the data structure and relations between tables. If your data is normalized, one record in one table could be related to records in other tables. For example, your application may insert data to “user” table which is related to “address” table using user_id. You will have to find all related rows and extract them.

Next step will be to load this data into the new master. Here comes the tricky part - if you prepared your setups beforehand, this could be simply a matter of running a couple of inserts. If not, this may be rather complex. It’s all about primary key and unique index values. If your primary key values are generated as unique on each server using some sort of UUID generator or using auto_increment_increment and auto_increment_offset settings in MySQL, you can be sure that the data from the old master you have to insert won’t cause primary key or unique key conflicts with data on the new master. Otherwise, you may have to manually modify data from the old master to ensure it can be inserted correctly. It sounds complex, so let’s take a look at an example.

Let’s imagine we insert rows using auto_increment on node A, which is a master. For the sake of simplicity, we will focus on a single row only. There are columns ‘id’ and ‘value’.

If we insert it without any particular setup, we’ll see entries like below:

1000, ‘some value0’
1001, ‘some value1’
1002, ‘some value2’
1003, ‘some value3’

Those will replicate to the slave (B). If the split brain happens and writes will be executed on both old and new master, we will end up with following situation:

A

1000, ‘some value0’
1001, ‘some value1’
1002, ‘some value2’
1003, ‘some value3’
1004, ‘some value4’
1005, ‘some value5’
1006, ‘some value7’

B

1000, ‘some value0’
1001, ‘some value1’
1002, ‘some value2’
1003, ‘some value3’
1004, ‘some value6’
1005, ‘some value8’
1006, ‘some value9’

As you can see, there’s no way to simply dump records with id of 1004, 1005 and 1006 from node A and store them on node B because we will end up with duplicated primary key entries. What needs to be done is to change values of id column in the rows that will be inserted to a value larger than the maximum value of the id column from the table. This is all what’s needed for single rows. For more complex relations, where multiple tables are involved, you may have to make the changes in multiple locations.

On the other hand, if we had anticipated this potential problem and configured our nodes to store odd id’s on node A and even id’s on node B, the problem would have been so much easier to solve.

Node A was configured with auto_increment_offset = 1 and auto_increment_increment = 2

Node B was configured with auto_increment_offset = 2 and auto_increment_increment = 2

This is how the data would look on node A before the split brain:

1001, ‘some value0’
1003, ‘some value1’
1005, ‘some value2’
1007, ‘some value3’

When split brain happened, it will look like below.

Node A:

1001, ‘some value0’
1003, ‘some value1’
1005, ‘some value2’
1007, ‘some value3’
1009, ‘some value4’
1011, ‘some value5’
1013, ‘some value7’

Node B:

1001, ‘some value0’
1003, ‘some value1’
1005, ‘some value2’
1007, ‘some value3’
1008, ‘some value6’
1010, ‘some value8’
1012, ‘some value9’

Now we can easily copy missing data from node A:

1009, ‘some value4’
1011, ‘some value5’
1013, ‘some value7’

And load it to node B ending up with following data set:

1001, ‘some value0’
1003, ‘some value1’
1005, ‘some value2’
1007, ‘some value3’
1008, ‘some value6’
1009, ‘some value4’
1010, ‘some value8’
1011, ‘some value5’
1012, ‘some value9’
1013, ‘some value7’

Sure, rows are not in the original order, but this should be ok. In the worst case scenario you will have to order by ‘value’ column in queries and maybe add an index on it to make the sorting fast.

Now, imagine hundreds or thousands of rows and a highly normalized table structure - to restore one row may mean you will have to restore several of them in additional tables. With a need to change id’s (because you didn’t have protective settings in place) across all related rows and all of this being manual work, you can imagine that this is not the best situation to be in. It takes time to recover and it is an error-prone process. Luckily, as we discussed at the beginning, there are means to minimize chances that split brain will impact your system or to reduce the work that needs to be done to sync back your nodes. Make sure you use them and stay prepared.

Webinar: MySQL & MariaDB Performance Tuning for Dummies

$
0
0

You’re running MySQL or MariaDB as backend database, how do you tune it to make best use of the hardware? How do you optimize the Operating System? How do you best configure MySQL or MariaDB for a specific database workload?

Do these questions sound familiar to you? Maybe you’re having to deal with that type of situation yourself?

MySQL & MariaDB Performance Tuning Webinar

A database server needs CPU, memory, disk and network in order to function. Understanding these resources is important for anybody managing a production database. Any resource that is weak or overloaded can become a limiting factor and cause the database server to perform poorly.

In this webinar, we’ll discuss some of the settings that are most often tweaked and which can bring you significant improvement in the performance of your MySQL or MariaDB database. We will also cover some of the variables which are frequently modified even though they should not.

Performance tuning is not easy, especially if you’re not an experienced DBA, but you can go a surprisingly long way with a few basic guidelines.

Date, Time & Registration

Europe/MEA/APAC

Tuesday, June 26th at 09:00 BST / 10:00 CEST (Germany, France, Sweden)

Register Now

North America/LatAm

Tuesday, June 26th at 09:00 Pacific Time (US) / 12:00 Eastern Time (US)

Register Now

Agenda

  • What to tune and why?
  • Tuning process
  • Operating system tuning
    • Memory
    • I/O performance
  • MySQL configuration tuning
    • Memory
    • I/O performance
  • Useful tools
  • Do’s and do not’s of MySQL tuning
  • Changes in MySQL 8.0

Speaker

Krzysztof Książek, Senior Support Engineer at Severalnines, is a MySQL DBA with experience managing complex database environments for companies like Zendesk, Chegg, Pinterest and Flipboard.

This webinar builds upon blog posts by Krzysztof from the ‘Become a MySQL DBA’ series.

We look forward to “seeing” you there!


ClusterControl Release 1.6.1: MariaDB Backup & PostgreSQL in the Cloud

$
0
0

We are excited to announce the 1.6.1 release of ClusterControl - the all-inclusive database management system that lets you easily deploy, monitor, manage and scale highly available open source databases in any environment: on-premise or in the cloud.

ClusterControl 1.6.1 introduces new Backup Management features for MariaDB, Deployment & Configuration Management features for PostgreSQL in the Cloud as well as a new Monitoring & Alerting feature with the integration with ServiceNow, the popular services management system for the enterprise … and more!

Release Highlights

For MariaDB - Backup Management Features

We’ve added Backup Management features with the addition of MariaDB Backup based clusters as well as support for MaxScale 2.2 (MariaDB’s load balancing technology).

For PostgreSQL - Deployment & Configuration Management Features

We’ve built new Deployment & Configuration Management features for deploying PostgreSQL to the Cloud. Users can also now easily deploy Synchronous Replication Slaves using this latest version of ClusterControl.

Monitoring & Alerting Feature - ServiceNow

ClusterControl users can now easily integrate with ServiceNow, the popular services management system for the enterprise.

Additional Highlights

We’ve also recently implemented improvements and fixes to ClusterControl’s MySQL (NDB) Cluster features.

View the ClusterControl ChangeLog for all the details!

ClusterControl
Single Console for Your Entire Database Infrastructure
Find out what else is new in ClusterControl

View Release Details and Resources

Release Details

For MariaDB - Backup Management Features

With MariaDB Server 10.1, the MariaDB team introduced MariaDB Compression and Data-at-Rest Encryption, which is supported by MariaDB Backup. It’s an open source tool provided by MariaDB (and a fork of Percona XtraBackup) for performing physical online backups of InnoDB, Aria and MyISAM tables.

ClusterControl 1.6.1 now features support for MariaDB Backup for MariaDB-based systems. Users can now easily create, restore and schedule backups for their MariaDB databases using MariaDB Backup - whether full or incremental. Let ClusterControl manage your backups, saving you time for the rest of the maintenance of your databases.

With ClusterControl 1.6.1, we also introduce support for MaxScale 2.2, MariaDB’s load balancing technology.

Scheduling a new backup with ClusterControl using MariaDB Backup:

For PostgreSQL - Deployment & Configuration Management Features

ClusterControl 1.6.1 introduces new cloud deployment features for our PostgreSQL users. Whether you’re looking to deploy PostgreSQL nodes using management/public IPs for monitoring connections and data/private IPs for replication traffic; or you’re looking to deploy HAProxy using management/public IPs and private IPs for configurations - ClusterControl does it for you.

ClusterControl now also automates the deployment of Synchronous Replication Slaves for PostgreSQL. Synchronous replication offers the ability to confirm that all changes made by a transaction have been transferred to one or more synchronous standby servers, which allows you to build data-loss-less PostgreSQL clusters; and faster failovers.

Deploying PostgreSQL in the Cloud:

Monitoring & Alerting Feature - ServiceNow

With this new release, we are pleased to announce that ServiceNow has been added as a new notifications integration to ClusterControl. This service management system provides technical management support (such as asset and license management) to the IT operations of large corporations, including help desk functionalities and is a very popular integration. This allows enterprises to connect ClusterControl with ServiceNow and benefit from both systems’ features.

Adding ServiceNow as a New Integration to ClusterControl:

Additional New Functionalities

View the ClusterControl ChangeLog for all the details!

Download ClusterControl today!

Happy Clustering!

MySQL on Docker: Running a MariaDB Galera Cluster without Container Orchestration Tools - Part 1

$
0
0

Container orchestration tools simplify the running of a distributed system, by deploying and redeploying containers and handling any failures that occur. One might need to move applications around, e.g., to handle updates, scaling, or underlying host failures. While this sounds great, it does not always work well with a strongly consistent database cluster like Galera. You can’t just move database nodes around, they are not stateless applications. Also, the order in which you perform operations on a cluster has high significance. For instance, restarting a Galera cluster has to start from the most advanced node, or else you will lose data. Therefore, we’ll show you how to run Galera Cluster on Docker without a container orchestration tool, so you have total control.

In this blog post, we are going to look into how to run a MariaDB Galera Cluster on Docker containers using the standard Docker image on multiple Docker hosts, without the help of orchestration tools like Swarm or Kubernetes. This approach is similar to running a Galera Cluster on standard hosts, but the process management is configured through Docker.

Before we jump further into details, we assume you have installed Docker, disabled SElinux/AppArmor and cleared up the rules inside iptables, firewalld or ufw (whichever you are using). The following are three dedicated Docker hosts for our database cluster:

  • host1.local - 192.168.55.161
  • host2.local - 192.168.55.162
  • host3.local - 192.168.55.163

Multi-host Networking

First of all, the default Docker networking is bound to the local host. Docker Swarm introduces another networking layer called overlay network, which extends the container internetworking to multiple Docker hosts in a cluster called Swarm. Long before this integration came into place, there were many network plugins developed to support this - Flannel, Calico, Weave are some of them.

Here, we are going to use Weave as the Docker network plugin for multi-host networking. This is mainly due to its simplicity to get it installed and running, and support for DNS resolver (containers running under this network can resolve each other's hostname). There are two ways to get Weave running - systemd or through Docker. We are going to install it as a systemd unit, so it's independent from Docker daemon (otherwise, we would have to start Docker first before Weave gets activated).

  1. Download and install Weave:

    $ curl -L git.io/weave -o /usr/local/bin/weave
    $ chmod a+x /usr/local/bin/weave
  2. Create a systemd unit file for Weave:

    $ cat > /etc/systemd/system/weave.service << EOF
    [Unit]
    Description=Weave Network
    Documentation=http://docs.weave.works/weave/latest_release/
    Requires=docker.service
    After=docker.service
    [Service]
    EnvironmentFile=-/etc/sysconfig/weave
    ExecStartPre=/usr/local/bin/weave launch --no-restart $PEERS
    ExecStart=/usr/bin/docker attach weave
    ExecStop=/usr/local/bin/weave stop
    [Install]
    WantedBy=multi-user.target
    EOF
  3. Define IP addresses or hostname of the peers inside /etc/sysconfig/weave:

    $ echo 'PEERS="192.168.55.161 192.168.55.162 192.168.55.163"'> /etc/sysconfig/weave
  4. Start and enable Weave on boot:

    $ systemctl start weave
    $ systemctl enable weave

Repeat the above 4 steps on all Docker hosts. Verify with the following command once done:

$ weave status

The number of peers is what we are looking after. It should be 3:

          ...
          Peers: 3 (with 6 established connections)
          ...

Running a Galera Cluster

Now the network is ready, it's time to fire our database containers and form a cluster. The basic rules are:

  • Container must be created under --net=weave to have multi-host connectivity.
  • Container ports that need to be published are 3306, 4444, 4567, 4568.
  • The Docker image must support Galera. If you'd like to use Oracle MySQL, then get the Codership version. If you'd like Percona's, use this image instead. In this blog post, we are using MariaDB's.

The reasons we chose MariaDB as the Galera cluster vendor are:

  • Galera is embedded into MariaDB, starting from MariaDB 10.1.
  • The MariaDB image is maintained by the Docker and MariaDB teams.
  • One of the most popular Docker images out there.

Bootstrapping a Galera Cluster has to be performed in sequence. Firstly, the most up-to-date node must be started with "wsrep_cluster_address=gcomm://". Then, start the remaining nodes with a full address consisting of all nodes in the cluster, e.g, "wsrep_cluster_address=gcomm://node1,node2,node3". To accomplish these steps using container, we have to do some extra steps to ensure all containers are running homogeneously. So the plan is:

  1. We would need to start with 4 containers in this order - mariadb0 (bootstrap), mariadb2, mariadb3, mariadb1.
  2. Container mariadb0 will be using the same datadir and configdir with mariadb1.
  3. Use mariadb0 on host1 for the first bootstrap, then start mariadb2 on host2, mariadb3 on host3.
  4. Remove mariadb0 on host1 to give way for mariadb1.
  5. Lastly, start mariadb1 on host1.

At the end of the day, you would have a three-node Galera Cluster (mariadb1, mariadb2, mariadb3). The first container (mariadb0) is a transient container for bootstrapping purposes only, using cluster address "gcomm://". It shares the same datadir and configdir with mariadb1 and will be removed once the cluster is formed (mariadb2 and mariadb3 are up) and nodes are synced.

By default, Galera is turned off in MariaDB and needs to be enabled with a flag called wsrep_on (set to ON) and wsrep_provider (set to the Galera library path) plus a number of Galera-related parameters. Thus, we need to define a custom configuration file for the container to configure Galera correctly.

Let's start with the first container, mariadb0. Create a file under /containers/mariadb0/conf.d/my.cnf and add the following lines:

$ mkdir -p /containers/mariadb0/conf.d
$ cat /containers/mariadb0/conf.d/my.cnf
[mysqld]

default_storage_engine          = InnoDB
binlog_format                   = ROW

innodb_flush_log_at_trx_commit  = 0
innodb_flush_method             = O_DIRECT
innodb_file_per_table           = 1
innodb_autoinc_lock_mode        = 2
innodb_lock_schedule_algorithm  = FCFS # MariaDB >10.1.19 and >10.2.3 only

wsrep_on                        = ON
wsrep_provider                  = /usr/lib/galera/libgalera_smm.so
wsrep_sst_method                = xtrabackup-v2

Since the image doesn't come with MariaDB Backup (which is the preferred SST method for MariaDB 10.1 and MariaDB 10.2), we are going to stick with xtrabackup-v2 for the time being.

To perform the first bootstrap for the cluster, run the bootstrap container (mariadb0) on host1:

$ docker run -d \
        --name mariadb0 \
        --hostname mariadb0.weave.local \
        --net weave \
        --publish "3306" \
        --publish "4444" \
        --publish "4567" \
        --publish "4568" \
        $(weave dns-args) \
        --env MYSQL_ROOT_PASSWORD="PM7%cB43$sd@^1" \
        --env MYSQL_USER=proxysql \
        --env MYSQL_PASSWORD=proxysqlpassword \
        --volume /containers/mariadb1/datadir:/var/lib/mysql \
        --volume /containers/mariadb1/conf.d:/etc/mysql/mariadb.conf.d \
        mariadb:10.2.15 \
        --wsrep_cluster_address=gcomm:// \
        --wsrep_sst_auth="root:PM7%cB43$sd@^1" \
        --wsrep_node_address=mariadb0.weave.local

The parameters used in the the above command are:

  • --name, creates the container named "mariadb0",
  • --hostname, assigns the container a hostname "mariadb0.weave.local",
  • --net, places the container in the weave network for multi-host networing support,
  • --publish, exposes ports 3306, 4444, 4567, 4568 on the container to the host,
  • $(weave dns-args), configures DNS resolver for this container. This command can be translated into Docker run as "--dns=172.17.0.1 --dns-search=weave.local.",
  • --env MYSQL_ROOT_PASSWORD, the MySQL root password,
  • --env MYSQL_USER, creates "proxysql" user to be used later with ProxySQL for database routing,
  • --env MYSQL_PASSWORD, the "proxysql" user password,
  • --volume /containers/mariadb1/datadir:/var/lib/mysql, creates /containers/mariadb1/datadir if does not exist and map it with /var/lib/mysql (MySQL datadir) of the container (for bootstrap node, this could be skipped),
  • --volume /containers/mariadb1/conf.d:/etc/mysql/mariadb.conf.d, mounts the files under directory /containers/mariadb1/conf.d of the Docker host, into the container at /etc/mysql/mariadb.conf.d.
  • mariadb:10.2.15, uses MariaDB 10.2.15 image from here,
  • --wsrep_cluster_address, Galera connection string for the cluster. "gcomm://" means bootstrap. For the rest of the containers, we are going to use a full address instead.
  • --wsrep_sst_auth, authentication string for SST user. Use the same user as root,
  • --wsrep_node_address, the node hostname, in this case we are going to use the FQDN provided by Weave.

The bootstrap container contains several key things:

  • The name, hostname and wsrep_node_address is mariadb0, but it uses the volumes of mariadb1.
  • The cluster address is "gcomm://"
  • There are two additional --env parameters - MYSQL_USER and MYSQL_PASSWORD. This parameters will create additional user for our proxysql monitoring purpose.

Verify with the following command:

$ docker ps
$ docker logs -f mariadb0

Once you see the following line, it indicates the bootstrap process is completed and Galera is active:

2018-05-30 23:19:30 139816524539648 [Note] WSREP: Synchronized with group, ready for connections

Create the directory to load our custom configuration file in the remaining hosts:

$ mkdir -p /containers/mariadb2/conf.d # on host2
$ mkdir -p /containers/mariadb3/conf.d # on host3

Then, copy the my.cnf that we've created for mariadb0 and mariadb1 to mariadb2 and mariadb3 respectively:

$ scp /containers/mariadb1/conf.d/my.cnf /containers/mariadb2/conf.d/ # on host1
$ scp /containers/mariadb1/conf.d/my.cnf /containers/mariadb3/conf.d/ # on host1

Next, create another 2 database containers (mariadb2 and mariadb3) on host2 and host3 respectively:

$ docker run -d \
        --name ${NAME} \
        --hostname ${NAME}.weave.local \
        --net weave \
        --publish "3306:3306" \
        --publish "4444" \
        --publish "4567" \
        --publish "4568" \
        $(weave dns-args) \
        --env MYSQL_ROOT_PASSWORD="PM7%cB43$sd@^1" \
        --volume /containers/${NAME}/datadir:/var/lib/mysql \
        --volume /containers/${NAME}/conf.d:/etc/mysql/mariadb.conf.d \
        mariadb:10.2.15 \
    
--wsrep_cluster_address=gcomm://mariadb0.weave.local,mariadb1.weave.local,mariadb2.weave.local,mariadb3.weave.local \
        --wsrep_sst_auth="root:PM7%cB43$sd@^1" \
        --wsrep_node_address=${NAME}.weave.local

** Replace ${NAME} with mariadb2 or mariadb3 respectively.

However, there is a catch. The entrypoint script checks the mysqld service in the background after database initialization by using MySQL root user without password. Since Galera automatically performs synchronization through SST or IST when starting up, the MySQL root user password will change, mirroring the bootstrapped node. Thus, you would see the following error during the first start up:

018-05-30 23:27:13 140003794790144 [Warning] Access denied for user 'root'@'localhost' (using password: NO)
MySQL init process in progress…
MySQL init process failed.

The trick is to restart the failed containers once more, because this time, the MySQL datadir would have been created (in the first run attempt) and it would skip the database initialization part:

$ docker start mariadb2 # on host2
$ docker start mariadb3 # on host3

Once started, verify by looking at the following line:

$ docker logs -f mariadb2
…
2018-05-30 23:28:39 139808069601024 [Note] WSREP: Synchronized with group, ready for connections

At this point, there are 3 containers running, mariadb0, mariadb2 and mariadb3. Take note that mariadb0 is started using the bootstrap command (gcomm://), which means if the container is automatically restarted by Docker in the future, it could potentially become disjointed with the primary component. Thus, we need to remove this container and replace it with mariadb1, using the same Galera connection string with the rest and use the same datadir and configdir with mariadb0.

First, stop mariadb0 by sending SIGTERM (to ensure the node is going to be shutdown gracefully):

$ docker kill -s 15 mariadb0

Then, start mariadb1 on host1 using similar command as mariadb2 or mariadb3:

$ docker run -d \
        --name mariadb1 \
        --hostname mariadb1.weave.local \
        --net weave \
        --publish "3306:3306" \
        --publish "4444" \
        --publish "4567" \
        --publish "4568" \
        $(weave dns-args) \
        --env MYSQL_ROOT_PASSWORD="PM7%cB43$sd@^1" \
        --volume /containers/mariadb1/datadir:/var/lib/mysql \
        --volume /containers/mariadb1/conf.d:/etc/mysql/mariadb.conf.d \
        mariadb:10.2.15 \
    
--wsrep_cluster_address=gcomm://mariadb0.weave.local,mariadb1.weave.local,mariadb2.weave.local,mariadb3.weave.local \
        --wsrep_sst_auth="root:PM7%cB43$sd@^1" \
        --wsrep_node_address=mariadb1.weave.local

This time, you don't need to do the restart trick because MySQL datadir already exists (created by mariadb0). Once the container is started, verify the cluster size is 3, the status must be in Primary and the local state is synced:

$ docker exec -it mariadb3 mysql -uroot "-pPM7%cB43$sd@^1" -e 'select variable_name, variable_value from information_schema.global_status where variable_name in ("wsrep_cluster_size", "wsrep_local_state_comment", "wsrep_cluster_status", "wsrep_incoming_addresses")'
+---------------------------+-------------------------------------------------------------------------------+
| variable_name             | variable_value                                                                |
+---------------------------+-------------------------------------------------------------------------------+
| WSREP_CLUSTER_SIZE        | 3                                                                             |
| WSREP_CLUSTER_STATUS      | Primary                                                                       |
| WSREP_INCOMING_ADDRESSES  | mariadb1.weave.local:3306,mariadb3.weave.local:3306,mariadb2.weave.local:3306 |
| WSREP_LOCAL_STATE_COMMENT | Synced                                                                        |
+---------------------------+-------------------------------------------------------------------------------+

At this point, our architecture is looking something like this:

Although the run command is pretty long, it well describes the container's characteristics. It's probably a good idea to wrap the command in a script to simplify the execution steps, or use a compose file instead.

Database Routing with ProxySQL

Now we have three database containers running. The only way to access to the cluster now is to access the individual Docker host’s published port of MySQL, which is 3306 (map to 3306 to the container). So what happens if one of the database containers fails? You have to manually failover the client's connection to the next available node. Depending on the application connector, you could also specify a list of nodes and let the connector do the failover and query routing for you (Connector/J, PHP mysqlnd). Otherwise, it would be a good idea to unify the database resources into a single resource, that can be called a service.

This is where ProxySQL comes into the picture. ProxySQL can act as the query router, load balancing the database connections similar to what "Service" in Swarm or Kubernetes world can do. We have built a ProxySQL Docker image for this purpose and will maintain the image for every new version with our best effort.

Before we run the ProxySQL container, we have to prepare the configuration file. The following is what we have configured for proxysql1. We create a custom configuration file under /containers/proxysql1/proxysql.cnf on host1:

$ cat /containers/proxysql1/proxysql.cnf
datadir="/var/lib/proxysql"
admin_variables=
{
        admin_credentials="admin:admin"
        mysql_ifaces="0.0.0.0:6032"
        refresh_interval=2000
}
mysql_variables=
{
        threads=4
        max_connections=2048
        default_query_delay=0
        default_query_timeout=36000000
        have_compress=true
        poll_timeout=2000
        interfaces="0.0.0.0:6033;/tmp/proxysql.sock"
        default_schema="information_schema"
        stacksize=1048576
        server_version="5.1.30"
        connect_timeout_server=10000
        monitor_history=60000
        monitor_connect_interval=200000
        monitor_ping_interval=200000
        ping_interval_server=10000
        ping_timeout_server=200
        commands_stats=true
        sessions_sort=true
        monitor_username="proxysql"
        monitor_password="proxysqlpassword"
}
mysql_servers =
(
        { address="mariadb1.weave.local" , port=3306 , hostgroup=10, max_connections=100 },
        { address="mariadb2.weave.local" , port=3306 , hostgroup=10, max_connections=100 },
        { address="mariadb3.weave.local" , port=3306 , hostgroup=10, max_connections=100 },
        { address="mariadb1.weave.local" , port=3306 , hostgroup=20, max_connections=100 },
        { address="mariadb2.weave.local" , port=3306 , hostgroup=20, max_connections=100 },
        { address="mariadb3.weave.local" , port=3306 , hostgroup=20, max_connections=100 }
)
mysql_users =
(
        { username = "sbtest" , password = "password" , default_hostgroup = 10 , active = 1 }
)
mysql_query_rules =
(
        {
                rule_id=100
                active=1
                match_pattern="^SELECT .* FOR UPDATE"
                destination_hostgroup=10
                apply=1
        },
        {
                rule_id=200
                active=1
                match_pattern="^SELECT .*"
                destination_hostgroup=20
                apply=1
        },
        {
                rule_id=300
                active=1
                match_pattern=".*"
                destination_hostgroup=10
                apply=1
        }
)
scheduler =
(
        {
                id = 1
                filename = "/usr/share/proxysql/tools/proxysql_galera_checker.sh"
                active = 1
                interval_ms = 2000
                arg1 = "10"
                arg2 = "20"
                arg3 = "1"
                arg4 = "1"
                arg5 = "/var/lib/proxysql/proxysql_galera_checker.log"
        }
)

The above configuration will:

  • configure two host groups, the single-writer and multi-writer group, as defined under "mysql_servers" section,
  • send reads to all Galera nodes (hostgroup 20) while write operations will go to a single Galera server (hostgroup 10),
  • schedule the proxysql_galera_checker.sh,
  • use monitor_username and monitor_password as the monitoring credentials created when we first bootstrapped the cluster (mariadb0).

Copy the configuration file to host2, for ProxySQL redundancy:

$ mkdir -p /containers/proxysql2/ # on host2
$ scp /containers/proxysql1/proxysql.cnf /container/proxysql2/ # on host1

Then, run the ProxySQL containers on host1 and host2 respectively:

$ docker run -d \
        --name=${NAME} \
        --publish 6033 \
        --publish 6032 \
        --restart always \
        --net=weave \
        $(weave dns-args) \
        --hostname ${NAME}.weave.local \
        -v /containers/${NAME}/proxysql.cnf:/etc/proxysql.cnf \
        -v /containers/${NAME}/data:/var/lib/proxysql \
        severalnines/proxysql

** Replace ${NAME} with proxysql1 or proxysql2 respectively.

We specified --restart=always to make it always available regardless of the exit status, as well as automatic startup when Docker daemon starts. This will make sure the ProxySQL containers act like a daemon.

Verify the MySQL servers status monitored by both ProxySQL instances (OFFLINE_SOFT is expected for the single-writer host group):

$ docker exec -it proxysql1 mysql -uadmin -padmin -h127.0.0.1 -P6032 -e 'select hostgroup_id,hostname,status from mysql_servers'
+--------------+----------------------+--------------+
| hostgroup_id | hostname             | status       |
+--------------+----------------------+--------------+
| 10           | mariadb1.weave.local | ONLINE       |
| 10           | mariadb2.weave.local | OFFLINE_SOFT |
| 10           | mariadb3.weave.local | OFFLINE_SOFT |
| 20           | mariadb1.weave.local | ONLINE       |
| 20           | mariadb2.weave.local | ONLINE       |
| 20           | mariadb3.weave.local | ONLINE       |
+--------------+----------------------+--------------+

At this point, our architecture is looking something like this:

All connections coming from 6033 (either from the host1, host2 or container's network) will be load balanced to the backend database containers using ProxySQL. If you would like to access an individual database server, use port 3306 of the physical host instead. There is no virtual IP address as single endpoint configured for the ProxySQL service, but we could have that by using Keepalived, which is explained in the next section.

Virtual IP Address with Keepalived

Since we configured ProxySQL containers to be running on host1 and host2, we are going to use Keepalived containers to tie these hosts together and provide virtual IP address via the host network. This allows a single endpoint for applications or clients to connect to the load balancing layer backed by ProxySQL.

As usual, create a custom configuration file for our Keepalived service. Here is the content of /containers/keepalived1/keepalived.conf:

vrrp_instance VI_DOCKER {
   interface ens33               # interface to monitor
   state MASTER
   virtual_router_id 52          # Assign one ID for this route
   priority 101
   unicast_src_ip 192.168.55.161
   unicast_peer {
      192.168.55.162
   }
   virtual_ipaddress {
      192.168.55.160             # the virtual IP
}

Copy the configuration file to host2 for the second instance:

$ mkdir -p /containers/keepalived2/ # on host2
$ scp /containers/keepalived1/keepalived.conf /container/keepalived2/ # on host1

Change the priority from 101 to 100 inside the copied configuration file on host2:

$ sed -i 's/101/100/g' /containers/keepalived2/keepalived.conf

**The higher priority instance will hold the virtual IP address (in this case is host1), until the VRRP communication is interrupted (in case host1 goes down).

Then, run the following command on host1 and host2 respectively:

$ docker run -d \
        --name=${NAME} \
        --cap-add=NET_ADMIN \
        --net=host \
        --restart=always \
        --volume /containers/${NAME}/keepalived.conf:/usr/local/etc/keepalived/keepalived.conf \ osixia/keepalived:1.4.4

** Replace ${NAME} with keepalived1 and keepalived2.

The run command tells Docker to:

  • --name, create a container with
  • --cap-add=NET_ADMIN, add Linux capabilities for network admin scope
  • --net=host, attach the container into the host network. This will provide virtual IP address on the host interface, ens33
  • --restart=always, always keep the container running,
  • --volume=/containers/${NAME}/keepalived.conf:/usr/local/etc/keepalived/keepalived.conf, map the custom configuration file for container's usage.

After both containers are started, verify the virtual IP address existence by looking at the physical network interface of the MASTER node:

$ ip a | grep ens33
2: ens33: <BROADCAST,MULTICAST,UP,LOWER_UP> mtu 1500 qdisc pfifo_fast state UP qlen 1000
    inet 192.168.55.161/24 brd 192.168.55.255 scope global ens33
    inet 192.168.55.160/32 scope global ens33

The clients and applications may now use the virtual IP address, 192.168.55.160 to access the database service. This virtual IP address exists on host1 at this moment. If host1 goes down, keepalived2 will take over the IP address and bring it up on host2. Take note that the configuration for this keepalived does not monitor the ProxySQL containers. It only monitors the VRRP advertisement of the Keepalived peers.

At this point, our architecture is looking something like this:

Summary

So, now we have a MariaDB Galera Cluster fronted by a highly available ProxySQL service, all running on Docker containers.

In part two, we are going to look into how to manage this setup. We’ll look at how to perform operations like graceful shutdown, bootstrapping, detecting the most advanced node, failover, recovery, scaling up/down, upgrades, backup and so on. We will also discuss the pros and cons of having this setup for our clustered database service.

Happy containerizing!

How to Benchmark Performance of MySQL & MariaDB using SysBench

$
0
0

What is SysBench? If you work with MySQL on a regular basis, then you most probably have heard of it. SysBench has been in the MySQL ecosystem for a long time. It was originally written by Peter Zaitsev, back in 2004. Its purpose was to provide a tool to run synthetic benchmarks of MySQL and the hardware it runs on. It was designed to run CPU, memory and I/O tests. It had also an option to execute OLTP workload on a MySQL database. OLTP stands for online transaction processing, typical workload for online applications like e-commerce, order entry or financial transaction systems.

In this blog post, we will focus on the SQL benchmark feature but keep in mind that hardware benchmarks can also be very useful in identifying issues on database servers. For example, I/O benchmark was intended to simulate InnoDB I/O workload while CPU tests involve simulation of highly concurrent, multi-treaded environment along with tests for mutex contentions - something which also resembles a database type of workload.

SysBench history and architecture

As mentioned, SysBench was originally created in 2004 by Peter Zaitsev. Soon after, Alexey Kopytov took over its development. It reached version 0.4.12 and the development halted. After a long break Alexey started to work on SysBench again in 2016. Soon version 0.5 has been released with OLTP benchmark rewritten to use LUA-based scripts. Then, in 2017, SysBench 1.0 was released. This was like day and night compared to the old, 0.4.12 version. First and the foremost, instead of hardcoded scripts, now we have the ability to customize benchmarks using LUA. For instance, Percona created TPCC-like benchmark which can be executed using SysBench. Let’s take a quick look at the current SysBench architecture.

SysBench is a C binary which uses LUA scripts to execute benchmarks. Those scripts have to:

  1. Handle input from command line parameters
  2. Define all of the modes which the benchmark is supposed to use (prepare, run, cleanup)
  3. Prepare all of the data
  4. Define how the benchmark will be executed (what queries will look like etc)

Scripts can utilize multiple connections to the database, they can also process results should you want to create complex benchmarks where queries depend on the result set of previous queries. With SysBench 1.0 it is possible to create latency histograms. It is also possible for the LUA scripts to catch and handle errors through error hooks. There’s support for parallelization in the LUA scripts, multiple queries can be executed in parallel, making, for example, provisioning much faster. Last but not least, multiple output formats are now supported. Before SysBench generated only human-readable output. Now it is possible to generate it as CSV or JSON, making it much easier to do post-processing and generate graphs using, for example, gnuplot or feed the data into Prometheus, Graphite or similar datastore.

Why SysBench?

The main reason why SysBench became popular is the fact that it is simple to use. Someone without prior knowledge can start to use it within minutes. It also provides, by default, benchmarks which cover most of the cases - OLTP workloads, read-only or read-write, primary key lookups and primary key updates. All which caused most of the issues for MySQL, up to MySQL 8.0. This was also a reason why SysBench was so popular in different benchmarks and comparisons published on the Internet. Those posts helped to promote this tool and made it into the go-to synthetic benchmark for MySQL.

Another good thing about SysBench is that, since version 0.5 and incorporation of LUA, anyone can prepare any kind of benchmark. We already mentioned TPCC-like benchmark but anyone can craft something which will resemble her production workload. We are not saying it is simple, it will be most likely a time-consuming process, but having this ability is beneficial if you need to prepare a custom benchmark.

Being a synthetic benchmark, SysBench is not a tool which you can use to tune configurations of your MySQL servers (unless you prepared LUA scripts with custom workload or your workload happen to be very similar to the benchmark workloads that SysBench comes with). What it is great for is to compare performance of different hardware. You can easily compare performance of, let’s say, different type of nodes offered by your cloud provider and maximum QPS (queries per second) they offer. Knowing that metric and knowing what you pay for given node, you can then calculate even more important metric - QP$ (queries per dollar). This will allow you to identify what node type to use when building a cost-efficient environment. Of course, SysBench can be used also for initial tuning and assessing feasibility of a given design. Let’s say we build a Galera cluster spanning across the globe - North America, EU, Asia. How many inserts per second can such a setup handle? What would be the commit latency? Does it even make sense to do a proof of concept or maybe network latency is high enough that even a simple workload does not work as you would expect it to.

What about stress-testing? Not everyone has moved to the cloud, there are still companies preferring to build their own infrastructure. Every new server acquired should go through a warm-up period during which you will stress it to pinpoint potential hardware defects. In this case SysBench can also help. Either by executing OLTP workload which overloads the server, or you can also use dedicated benchmarks for CPU, disk and memory.

As you can see, there are many cases in which even a simple, synthetic benchmark can be very useful. In the next paragraph we will look at what we can do with SysBench.

What SysBench can do for you?

What tests you can run?

As mentioned at the beginning, we will focus on OLTP benchmarks and just as a reminder we’ll repeat that SysBench can also be used to perform I/O, CPU and memory tests. Let’s take a look at the benchmarks that SysBench 1.0 comes with (we removed some helper LUA files and non-database LUA scripts from this list).

-rwxr-xr-x 1 root root 1.5K May 30 07:46 bulk_insert.lua
-rwxr-xr-x 1 root root 1.3K May 30 07:46 oltp_delete.lua
-rwxr-xr-x 1 root root 2.4K May 30 07:46 oltp_insert.lua
-rwxr-xr-x 1 root root 1.3K May 30 07:46 oltp_point_select.lua
-rwxr-xr-x 1 root root 1.7K May 30 07:46 oltp_read_only.lua
-rwxr-xr-x 1 root root 1.8K May 30 07:46 oltp_read_write.lua
-rwxr-xr-x 1 root root 1.1K May 30 07:46 oltp_update_index.lua
-rwxr-xr-x 1 root root 1.2K May 30 07:46 oltp_update_non_index.lua
-rwxr-xr-x 1 root root 1.5K May 30 07:46 oltp_write_only.lua
-rwxr-xr-x 1 root root 1.9K May 30 07:46 select_random_points.lua
-rwxr-xr-x 1 root root 2.1K May 30 07:46 select_random_ranges.lua

Let’s go through them one by one.

First, bulk_insert.lua. This test can be used to benchmark the ability of MySQL to perform multi-row inserts. This can be quite useful when checking, for example, performance of replication or Galera cluster. In the first case, it can help you answer a question: “how fast can I insert before replication lag will kick in?”. In the later case, it will tell you how fast data can be inserted into a Galera cluster given the current network latency.

All oltp_* scripts share a common table structure. First two of them (oltp_delete.lua and oltp_insert.lua) execute single DELETE and INSERT statements. Again, this could be a test for either replication or Galera cluster - push it to the limits and see what amount of inserting or purging it can handle. We also have other benchmarks focused on particular functionality - oltp_point_select, oltp_update_index and oltp_update_non_index. These will execute a subset of queries - primary key-based selects, index-based updates and non-index-based updates. If you want to test some of these functionalities, the tests are there. We also have more complex benchmarks which are based on OLTP workloads: oltp_read_only, oltp_read_write and oltp_write_only. You can run either a read-only workload, which will consist of different types of SELECT queries, you can run only writes (a mix of DELETE, INSERT and UPDATE) or you can run a mix of those two. Finally, using select_random_points and select_random_ranges you can run some random SELECT either using random points in IN() list or random ranges using BETWEEN.

How you can configure a benchmark?

What is also important, benchmarks are configurable - you can run different workload patterns using the same benchmark. Let’s take a look at the two most common benchmarks to execute. We’ll have a deep dive into OLTP read_only and OLTP read_write benchmarks. First of all, SysBench has some general configuration options. We will discuss here only the most important ones, you can check all of them by running:

sysbench --help

Let’s take a look at them.

  --threads=N                     number of threads to use [1]

You can define what kind of concurrency you’d like SysBench to generate. MySQL, as every software, has some scalability limitations and its performance will peak at some level of concurrency. This setting helps to simulate different concurrencies for a given workload and check if it already has passed the sweet spot.

  --events=N                      limit for total number of events [0]
  --time=N                        limit for total execution time in seconds [10]

Those two settings govern how long SysBench should keep running. It can either execute some number of queries or it can keep running for a predefined time.

  --warmup-time=N                 execute events for this many seconds with statistics disabled before the actual benchmark run with statistics enabled [0]

This is self-explanatory. SysBench generates statistical results from the tests and those results may be affected if MySQL is in a cold state. Warmup helps to identify “regular” throughput by executing benchmark for a predefined time, allowing to warm up the cache, buffer pools etc.

  --rate=N                        average transactions rate. 0 for unlimited rate [0]

By default SysBench will attempt to execute queries as fast as possible. To simulate slower traffic this option may be used. You can define here how many transactions should be executed per second.

  --report-interval=N             periodically report intermediate statistics with a specified interval in seconds. 0 disables intermediate reports [0]

By default SysBench generates a report after it completed its run and no progress is reported while the benchmark is running. Using this option you can make SysBench more verbose while the benchmark still runs.

  --rand-type=STRING   random numbers distribution {uniform, gaussian, special, pareto, zipfian} to use by default [special]

SysBench gives you ability to generate different types of data distribution. All of them may have their own purposes. Default option, ‘special’, defines several (it is configurable) hot-spots in the data, something which is quite common in web applications. You can also use other distributions if your data behaves in a different way. By making a different choice here you can also change the way your database is stressed. For example, uniform distribution, where all of the rows have the same likeliness of being accessed, is much more memory-intensive operation. It will use more buffer pool to store all of the data and it will be much more disk-intensive if your data set won’t fit in memory. On the other hand, special distribution with couple of hot-spots will put less stress on the disk as hot rows are more likely to be kept in the buffer pool and access to rows stored on disk is much less likely. For some of the data distribution types, SysBench gives you more tweaks. You can find this info in ‘sysbench --help’ output.

  --db-ps-mode=STRING prepared statements usage mode {auto, disable} [auto]

Using this setting you can decide if SysBench should use prepared statements (as long as they are available in the given datastore - for MySQL it means PS will be enabled by default) or not. This may make a difference while working with proxies like ProxySQL or MaxScale - they should treat prepared statements in a special way and all of them should be routed to one host making it impossible to test scalability of the proxy.

In addition to the general configuration options, each of the tests may have its own configuration. You can check what is possible by running:

root@vagrant:~# sysbench ./sysbench/src/lua/oltp_read_write.lua  help
sysbench 1.1.0-2e6b7d5 (using bundled LuaJIT 2.1.0-beta3)

oltp_read_only.lua options:
  --distinct_ranges=N           Number of SELECT DISTINCT queries per transaction [1]
  --sum_ranges=N                Number of SELECT SUM() queries per transaction [1]
  --skip_trx[=on|off]           Don't start explicit transactions and execute all queries in the AUTOCOMMIT mode [off]
  --secondary[=on|off]          Use a secondary index in place of the PRIMARY KEY [off]
  --create_secondary[=on|off]   Create a secondary index in addition to the PRIMARY KEY [on]
  --index_updates=N             Number of UPDATE index queries per transaction [1]
  --range_size=N                Range size for range SELECT queries [100]
  --auto_inc[=on|off]           Use AUTO_INCREMENT column as Primary Key (for MySQL), or its alternatives in other DBMS. When disabled, use client-generated IDs [on]
  --delete_inserts=N            Number of DELETE/INSERT combinations per transaction [1]
  --tables=N                    Number of tables [1]
  --mysql_storage_engine=STRING Storage engine, if MySQL is used [innodb]
  --non_index_updates=N         Number of UPDATE non-index queries per transaction [1]
  --table_size=N                Number of rows per table [10000]
  --pgsql_variant=STRING        Use this PostgreSQL variant when running with the PostgreSQL driver. The only currently supported variant is 'redshift'. When enabled, create_secondary is automatically disabled, and delete_inserts is set to 0
  --simple_ranges=N             Number of simple range SELECT queries per transaction [1]
  --order_ranges=N              Number of SELECT ORDER BY queries per transaction [1]
  --range_selects[=on|off]      Enable/disable all range SELECT queries [on]
  --point_selects=N             Number of point SELECT queries per transaction [10]

Again, we will discuss the most important options from here. First of all, you have a control of how exactly a transaction will look like. Generally speaking, it consists of different types of queries - INSERT, DELETE, different type of SELECT (point lookup, range, aggregation) and UPDATE (indexed, non-indexed). Using variables like:

  --distinct_ranges=N           Number of SELECT DISTINCT queries per transaction [1]
  --sum_ranges=N                Number of SELECT SUM() queries per transaction [1]
  --index_updates=N             Number of UPDATE index queries per transaction [1]
  --delete_inserts=N            Number of DELETE/INSERT combinations per transaction [1]
  --non_index_updates=N         Number of UPDATE non-index queries per transaction [1]
  --simple_ranges=N             Number of simple range SELECT queries per transaction [1]
  --order_ranges=N              Number of SELECT ORDER BY queries per transaction [1]
  --point_selects=N             Number of point SELECT queries per transaction [10]
  --range_selects[=on|off]      Enable/disable all range SELECT queries [on]

You can define what a transaction should look like. As you can see by looking at the default values, majority of queries are SELECTs - mainly point selects but also different types of range SELECTs (you can disable all of them by setting range_selects to off). You can tweak the workload towards more write-heavy workload by increasing the number of updates or INSERT/DELETE queries. It is also possible to tweak settings related to secondary indexes, auto increment but also data set size (number of tables and how many rows each of them should hold). This lets you customize your workload quite nicely.

  --skip_trx[=on|off]           Don't start explicit transactions and execute all queries in the AUTOCOMMIT mode [off]

This is another setting, quite important when working with proxies. By default, SysBench will attempt to execute queries in explicit transaction. This way the dataset will stay consistent and not affected: SysBench will, for example, execute INSERT and DELETE on the same row, making sure the data set will not grow (impacting your ability to reproduce results). However, proxies will treat explicit transactions differently - all queries executed within a transaction should be executed on the same host, thus removing the ability to scale the workload. Please keep in mind that disabling transactions will result in data set diverging from the initial point. It may also trigger some issues like duplicate key errors or such. To be able to disable transactions you may also want to look into:

  --mysql-ignore-errors=[LIST,...] list of errors to ignore, or "all" [1213,1020,1205]

This setting allows you to specify error codes from MySQL which SysBench should ignore (and not kill the connection). For example, to ignore errors like: error 1062 (Duplicate entry '6' for key 'PRIMARY') you should pass this error code: --mysql-ignore-errors=1062

What is also important, each benchmark should present a way to provision a data set for tests, run them and then clean it up after the tests complete. This is done using ‘prepare’, ‘run’ and ‘cleanup’ commands. We will show how this is done in the next section.

Examples

In this section we’ll go through some examples of what SysBench can be used for. As mentioned earlier, we’ll focus on the two most popular benchmarks - OLTP read only and OLTP read/write. Sometimes it may make sense to use other benchmarks, but at least we’ll be able to show you how those two can be customized.

Primary Key lookups

First of all, we have to decide which benchmark we will run, read-only or read-write. Technically speaking it does not make a difference as we can remove writes from R/W benchmark. Let’s focus on the read-only one.

As a first step, we have to prepare a data set. We need to decide how big it should be. For this particular benchmark, using default settings (so, secondary indexes are created), 1 million rows will result in ~240 MB of data. Ten tables, 1000 000 rows each equals to 2.4GB:

root@vagrant:~# du -sh /var/lib/mysql/sbtest/
2.4G    /var/lib/mysql/sbtest/
root@vagrant:~# ls -alh /var/lib/mysql/sbtest/
total 2.4G
drwxr-x--- 2 mysql mysql 4.0K Jun  1 12:12 .
drwxr-xr-x 6 mysql mysql 4.0K Jun  1 12:10 ..
-rw-r----- 1 mysql mysql   65 Jun  1 12:08 db.opt
-rw-r----- 1 mysql mysql 8.5K Jun  1 12:12 sbtest10.frm
-rw-r----- 1 mysql mysql 240M Jun  1 12:12 sbtest10.ibd
-rw-r----- 1 mysql mysql 8.5K Jun  1 12:10 sbtest1.frm
-rw-r----- 1 mysql mysql 240M Jun  1 12:10 sbtest1.ibd
-rw-r----- 1 mysql mysql 8.5K Jun  1 12:10 sbtest2.frm
-rw-r----- 1 mysql mysql 240M Jun  1 12:10 sbtest2.ibd
-rw-r----- 1 mysql mysql 8.5K Jun  1 12:10 sbtest3.frm
-rw-r----- 1 mysql mysql 240M Jun  1 12:10 sbtest3.ibd
-rw-r----- 1 mysql mysql 8.5K Jun  1 12:10 sbtest4.frm
-rw-r----- 1 mysql mysql 240M Jun  1 12:10 sbtest4.ibd
-rw-r----- 1 mysql mysql 8.5K Jun  1 12:11 sbtest5.frm
-rw-r----- 1 mysql mysql 240M Jun  1 12:11 sbtest5.ibd
-rw-r----- 1 mysql mysql 8.5K Jun  1 12:11 sbtest6.frm
-rw-r----- 1 mysql mysql 240M Jun  1 12:11 sbtest6.ibd
-rw-r----- 1 mysql mysql 8.5K Jun  1 12:11 sbtest7.frm
-rw-r----- 1 mysql mysql 240M Jun  1 12:11 sbtest7.ibd
-rw-r----- 1 mysql mysql 8.5K Jun  1 12:11 sbtest8.frm
-rw-r----- 1 mysql mysql 240M Jun  1 12:11 sbtest8.ibd
-rw-r----- 1 mysql mysql 8.5K Jun  1 12:12 sbtest9.frm
-rw-r----- 1 mysql mysql 240M Jun  1 12:12 sbtest9.ibd

This should give you idea how many tables you want and how big they should be. Let’s say we want to test in-memory workload so we want to create tables which will fit into InnoDB buffer pool. On the other hand, we want also to make sure there are enough tables not to become a bottleneck (or, that the amount of tables matches what you would expect in your production setup). Let’s prepare our dataset. Please keep in mind that, by default, SysBench looks for ‘sbtest’ schema which has to exist before you prepare the data set. You may have to create it manually.

root@vagrant:~# sysbench /root/sysbench/src/lua/oltp_read_only.lua --threads=4 --mysql-host=10.0.0.126 --mysql-user=sbtest --mysql-password=pass --mysql-port=3306 --tables=10 --table-size=1000000 prepare
sysbench 1.1.0-2e6b7d5 (using bundled LuaJIT 2.1.0-beta3)

Initializing worker threads...

Creating table 'sbtest2'...
Creating table 'sbtest3'...
Creating table 'sbtest4'...
Creating table 'sbtest1'...
Inserting 1000000 records into 'sbtest2'
Inserting 1000000 records into 'sbtest4'
Inserting 1000000 records into 'sbtest3'
Inserting 1000000 records into 'sbtest1'
Creating a secondary index on 'sbtest2'...
Creating a secondary index on 'sbtest3'...
Creating a secondary index on 'sbtest1'...
Creating a secondary index on 'sbtest4'...
Creating table 'sbtest6'...
Inserting 1000000 records into 'sbtest6'
Creating table 'sbtest7'...
Inserting 1000000 records into 'sbtest7'
Creating table 'sbtest5'...
Inserting 1000000 records into 'sbtest5'
Creating table 'sbtest8'...
Inserting 1000000 records into 'sbtest8'
Creating a secondary index on 'sbtest6'...
Creating a secondary index on 'sbtest7'...
Creating a secondary index on 'sbtest5'...
Creating a secondary index on 'sbtest8'...
Creating table 'sbtest10'...
Inserting 1000000 records into 'sbtest10'
Creating table 'sbtest9'...
Inserting 1000000 records into 'sbtest9'
Creating a secondary index on 'sbtest10'...
Creating a secondary index on 'sbtest9'...

Once we have our data, let’s prepare a command to run the test. We want to test Primary Key lookups therefore we will disable all other types of SELECT. We will also disable prepared statements as we want to test regular queries. We will test low concurrency, let’s say 16 threads. Our command may look like below:

sysbench /root/sysbench/src/lua/oltp_read_only.lua --threads=16 --events=0 --time=300 --mysql-host=10.0.0.126 --mysql-user=sbtest --mysql-password=pass --mysql-port=3306 --tables=10 --table-size=1000000 --range_selects=off --db-ps-mode=disable --report-interval=1 run

What did we do here? We set the number of threads to 16. We decided that we want our benchmark to run for 300 seconds, without a limit of executed queries. We defined connectivity to the database, number of tables and their size. We also disabled all range SELECTs, we also disabled prepared statements. Finally, we set report interval to one second. This is how a sample output may look like:

[ 297s ] thds: 16 tps: 97.21 qps: 1127.43 (r/w/o: 935.01/0.00/192.41) lat (ms,95%): 253.35 err/s: 0.00 reconn/s: 0.00
[ 298s ] thds: 16 tps: 195.32 qps: 2378.77 (r/w/o: 1985.13/0.00/393.64) lat (ms,95%): 189.93 err/s: 0.00 reconn/s: 0.00
[ 299s ] thds: 16 tps: 178.02 qps: 2115.22 (r/w/o: 1762.18/0.00/353.04) lat (ms,95%): 155.80 err/s: 0.00 reconn/s: 0.00
[ 300s ] thds: 16 tps: 217.82 qps: 2640.92 (r/w/o: 2202.27/0.00/438.65) lat (ms,95%): 125.52 err/s: 0.00 reconn/s: 0.00

Every second we see a snapshot of workload stats. This is quite useful to track and plot - final report will give you averages only. Intermediate results will make it possible to track the performance on a second by second basis. The final report may look like below:

SQL statistics:
    queries performed:
        read:                            614660
        write:                           0
        other:                           122932
        total:                           737592
    transactions:                        61466  (204.84 per sec.)
    queries:                             737592 (2458.08 per sec.)
    ignored errors:                      0      (0.00 per sec.)
    reconnects:                          0      (0.00 per sec.)

Throughput:
    events/s (eps):                      204.8403
    time elapsed:                        300.0679s
    total number of events:              61466

Latency (ms):
         min:                                   24.91
         avg:                                   78.10
         max:                                  331.91
         95th percentile:                      137.35
         sum:                              4800234.60

Threads fairness:
    events (avg/stddev):           3841.6250/20.87
    execution time (avg/stddev):   300.0147/0.02

You will find here information about executed queries and other (BEGIN/COMMIT) statements. You’ll learn how many transactions were executed, how many errors happened, what was the throughput and total elapsed time. You can also check latency metrics and the query distribution across threads.

If we were interested in latency distribution, we could also pass ‘--histogram’ argument to SysBench. This results in an additional output like below:

Latency histogram (values are in milliseconds)
       value  ------------- distribution ------------- count
      29.194 |******                                   1
      30.815 |******                                   1
      31.945 |***********                              2
      33.718 |******                                   1
      34.954 |***********                              2
      35.589 |******                                   1
      37.565 |***********************                  4
      38.247 |******                                   1
      38.942 |******                                   1
      39.650 |***********                              2
      40.370 |***********                              2
      41.104 |*****************                        3
      41.851 |*****************************            5
      42.611 |*****************                        3
      43.385 |*****************                        3
      44.173 |***********                              2
      44.976 |**************************************** 7
      45.793 |***********************                  4
      46.625 |***********                              2
      47.472 |*****************************            5
      48.335 |**************************************** 7
      49.213 |***********                              2
      50.107 |**********************************       6
      51.018 |***********************                  4
      51.945 |**************************************** 7
      52.889 |*****************                        3
      53.850 |*****************                        3
      54.828 |***********************                  4
      55.824 |***********                              2
      57.871 |***********                              2
      58.923 |***********                              2
      59.993 |******                                   1
      61.083 |******                                   1
      63.323 |***********                              2
      66.838 |******                                   1
      71.830 |******                                   1

Once we are good with our results, we can clean up the data:

sysbench /root/sysbench/src/lua/oltp_read_only.lua --threads=16 --events=0 --time=300 --mysql-host=10.0.0.126 --mysql-user=sbtest --mysql-password=pass --mysql-port=3306 --tables=10 --table-size=1000000 --range_selects=off --db-ps-mode=disable --report-interval=1 cleanup

Write-heavy traffic

Let’s imagine here that we want to execute a write-heavy (but not write-only) workload and, for example, test I/O subsystem’s performance. First of all, we have to decide how big the dataset should be. We’ll assume ~48GB of data (20 tables, 10 000 000 rows each). We need to prepare it. This time we will use the read-write benchmark.

root@vagrant:~# sysbench /root/sysbench/src/lua/oltp_read_write.lua --threads=4 --mysql-host=10.0.0.126 --mysql-user=sbtest --mysql-password=pass --mysql-port=3306 --tables=20 --table-size=10000000 prepare

Once this is done, we can tweak the defaults to force more writes into the query mix:

root@vagrant:~# sysbench /root/sysbench/src/lua/oltp_read_write.lua --threads=16 --events=0 --time=300 --mysql-host=10.0.0.126 --mysql-user=sbtest --mysql-password=pass --mysql-port=3306 --tables=20 --delete_inserts=10 --index_updates=10 --non_index_updates=10 --table-size=10000000 --db-ps-mode=disable --report-interval=1 run

As you can see from the intermediate results, transactions are now on a write-heavy side:

[ 5s ] thds: 16 tps: 16.99 qps: 946.31 (r/w/o: 231.83/680.50/33.98) lat (ms,95%): 1258.08 err/s: 0.00 reconn/s: 0.00
[ 6s ] thds: 16 tps: 17.01 qps: 955.81 (r/w/o: 223.19/698.59/34.03) lat (ms,95%): 1032.01 err/s: 0.00 reconn/s: 0.00
[ 7s ] thds: 16 tps: 12.00 qps: 698.91 (r/w/o: 191.97/482.93/24.00) lat (ms,95%): 1235.62 err/s: 0.00 reconn/s: 0.00
[ 8s ] thds: 16 tps: 14.01 qps: 683.43 (r/w/o: 195.12/460.29/28.02) lat (ms,95%): 1533.66 err/s: 0.00 reconn/s: 0.00

Understanding the results

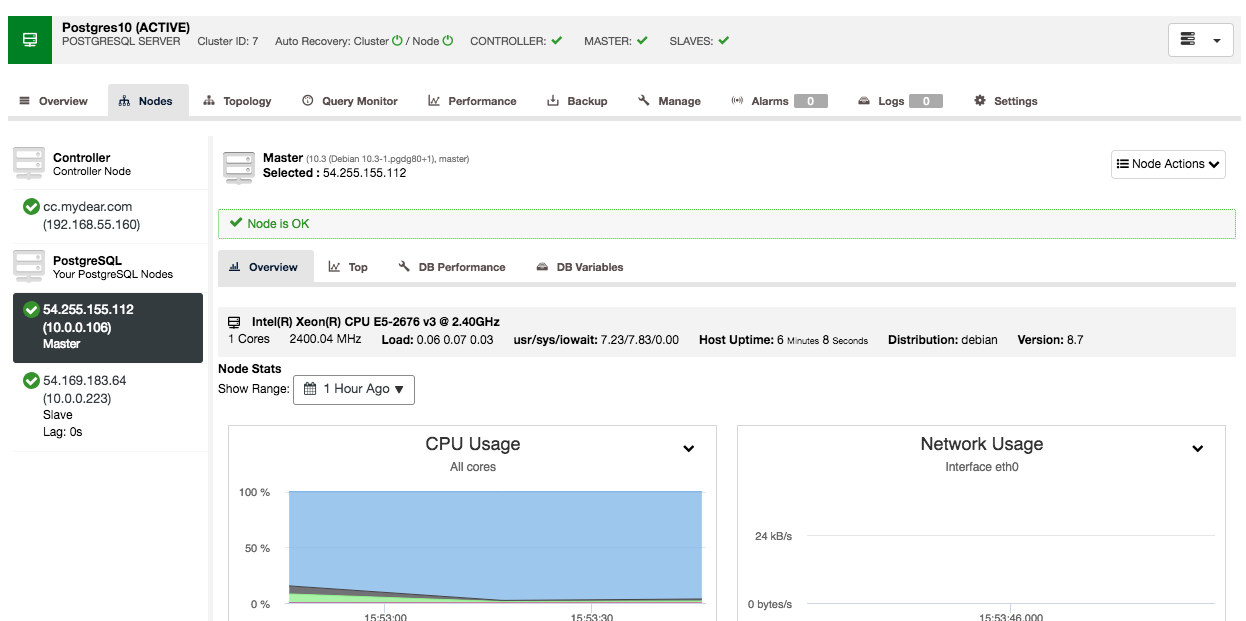
As we showed above, SysBench is a great tool which can help to pinpoint some of the performance issues of MySQL or MariaDB. It can also be used for initial tuning of your database configuration. Of course, you have to keep in mind that, to get the best out of your benchmarks, you have to understand why results look like they do. This would require insights into the MySQL internal metrics using monitoring tools, for instance, ClusterControl. This is quite important to remember - if you don’t understand why the performance was like it was, you may draw incorrect conclusions out of the benchmarks. There is always a bottleneck, and SysBench can help raise the performance issues, which you then have to identify.

MySQL on Docker: Running a MariaDB Galera Cluster without Orchestration Tools - DB Container Management - Part 2

$
0
0

As we saw in the first part of this blog, a strongly consistent database cluster like Galera does not play well with container orchestration tools like Kubernetes or Swarm. We showed you how to deploy Galera and configure process management for Docker, so you retain full control of the behaviour.  This blog post is the continuation of that, we are going to look into operation and maintenance of the cluster.

To recap some of the main points from the part 1 of this blog, we deployed a three-node Galera cluster, with ProxySQL and Keepalived on three different Docker hosts, where all MariaDB instances run as Docker containers. The following diagram illustrates the final deployment:

Graceful Shutdown

To perform a graceful MySQL shutdown, the best way is to send SIGTERM (signal 15) to the container:

$ docker kill -s 15 {db_container_name}

If you would like to shutdown the cluster, repeat the above command on all database containers, one node at a time. The above is similar to performing "systemctl stop mysql" in systemd service for MariaDB. Using "docker stop" command is pretty risky for database service because it waits for 10 seconds timeout and Docker will force SIGKILL if this duration is exceeded (unless you use a proper --timeout value).

The last node that shuts down gracefully will have the seqno not equal to -1 and safe_to_bootstrap flag is set to 1 in the /{datadir volume}/grastate.dat of the Docker host, for example on host2:

$ cat /containers/mariadb2/datadir/grastate.dat
# GALERA saved state
version: 2.1
uuid:    e70b7437-645f-11e8-9f44-5b204e58220b
seqno:   7099
safe_to_bootstrap: 1

Detecting the Most Advanced Node

If the cluster didn't shut down gracefully, or the node that you were trying to bootstrap wasn't the last node to leave the cluster, you probably wouldn't be able to bootstrap one of the Galera node and might encounter the following error:

2016-11-07 01:49:19 5572 [ERROR] WSREP: It may not be safe to bootstrap the cluster from this node.
It was not the last one to leave the cluster and may not contain all the updates.
To force cluster bootstrap with this node, edit the grastate.dat file manually and set safe_to_bootstrap to 1 .

Galera honours the node that has safe_to_bootstrap flag set to 1 as the first reference node. This is the safest way to avoid data loss and ensure the correct node always gets bootstrapped.

If you got the error, we have to find out the most advanced node first before picking up the node as the first to be bootstrapped. Create a transient container (with --rm flag), map it to the same datadir and configuration directory of the actual database container with two MySQL command flags, --wsrep_recover and --wsrep_cluster_address. For example, if we want to know mariadb1 last committed number, we need to run:

$ docker run --rm --name mariadb-recover \
        --env MYSQL_ROOT_PASSWORD="PM7%cB43$sd@^1" \
        --volume /containers/mariadb1/datadir:/var/lib/mysql \
        --volume /containers/mariadb1/conf.d:/etc/mysql/conf.d \
        mariadb:10.2.15 \
        --wsrep_recover \
        --wsrep_cluster_address=gcomm://
2018-06-12  4:46:35 139993094592384 [Note] mysqld (mysqld 10.2.15-MariaDB-10.2.15+maria~jessie) starting as process 1 ...
2018-06-12  4:46:35 139993094592384 [Note] InnoDB: Mutexes and rw_locks use GCC atomic builtins
...
2018-06-12  4:46:35 139993094592384 [Note] Plugin 'FEEDBACK' is disabled.
2018-06-12  4:46:35 139993094592384 [Note] Server socket created on IP: '::'.
2018-06-12  4:46:35 139993094592384 [Note] WSREP: Recovered position: e70b7437-645f-11e8-9f44-5b204e58220b:7099

The last line is what we are looking for. MariaDB prints out the cluster UUID and the sequence number of the most recently committed transaction. The node which holds the highest number is deemed as the most advanced node. Since we specified --rm, the container will be removed automatically once it exits. Repeat the above step on every Docker host by replacing the --volume path to the respective database container volumes.

Once you have compared the value reported by all database containers and decided which container is the most up-to-date node, change the safe_to_bootstrap flag to 1 inside /{datadir volume}/grastate.dat manually. Let's say all nodes are reporting the same exact sequence number, we can just pick mariadb3 to be bootstrapped by changing the safe_to_bootstrap value to 1:

$ vim /containers/mariadb3/datadir/grasate.dat
...
safe_to_bootstrap: 1

Save the file and start bootstrapping the cluster from that node, as described in the next chapter.

Bootstrapping the Cluster

Bootstrapping the cluster is similar to the first docker run command we used when starting up the cluster for the first time. If mariadb1 is the chosen bootstrap node, we can simply re-run the created bootstrap container:

$ docker start mariadb0 # on host1

Otherwise, if the bootstrap container does not exist on the chosen node, let's say on host2, run the bootstrap container command and map the existing mariadb2's volumes. We are using mariadb0 as the container name on host2 to indicate it is a bootstrap container:

$ docker run -d \
        --name mariadb0 \
        --hostname mariadb0.weave.local \
        --net weave \
        --publish "3306" \
        --publish "4444" \
        --publish "4567" \
        --publish "4568" \
        $(weave dns-args) \
        --env MYSQL_ROOT_PASSWORD="PM7%cB43$sd@^1" \
        --volume /containers/mariadb2/datadir:/var/lib/mysql \
        --volume /containers/mariadb2/conf.d:/etc/mysql/mariadb.conf.d \
        mariadb:10.2.15 \
        --wsrep_cluster_address=gcomm:// \
        --wsrep_sst_auth="root:PM7%cB43$sd@^1" \
        --wsrep_node_address=mariadb0.weave.local

You may notice that this command is slightly shorter as compared to the previous bootstrap command described in this guide. Since we already have the proxysql user created in our first bootstrap command, we may skip these two environment variables:

  • --env MYSQL_USER=proxysql
  • --env MYSQL_PASSWORD=proxysqlpassword

Then, start the remaining MariaDB containers, remove the bootstrap container and start the existing MariaDB container on the bootstrapped host. Basically the order of commands would be:

$ docker start mariadb1 # on host1
$ docker start mariadb3 # on host3
$ docker stop mariadb0 # on host2
$ docker start mariadb2 # on host2

At this point, the cluster is started and is running at full capacity.

Resource Control

Memory is a very important resource in MySQL. This is where the buffers and caches are stored, and it's critical for MySQL to reduce the impact of hitting the disk too often. On the other hand, swapping is bad for MySQL performance. By default, there will be no resource constraints on the running containers. Containers use as much of a given resource as the host’s kernel will allow. Another important thing is file descriptor limit. You can increase the limit of open file descriptor, or "nofile" to something higher to cater for the number of files MySQL server can open simultaneously. Setting this to a high value won't hurt.

To cap memory allocation and increase the file descriptor limit to our database container, one would append --memory, --memory-swap and --ulimit parameters into the "docker run" command:

$ docker kill -s 15 mariadb1
$ docker rm -f mariadb1
$ docker run -d \
        --name mariadb1 \
        --hostname mariadb1.weave.local \
        --net weave \
        --publish "3306:3306" \
        --publish "4444" \
        --publish "4567" \
        --publish "4568" \
        $(weave dns-args) \
        --memory 16g \
        --memory-swap 16g \
        --ulimit nofile:16000:16000 \
        --env MYSQL_ROOT_PASSWORD="PM7%cB43$sd@^1" \
        --volume /containers/mariadb1/datadir:/var/lib/mysql \
        --volume /containers/mariadb1/conf.d:/etc/mysql/mariadb.conf.d \
        mariadb:10.2.15 \
        --wsrep_cluster_address=gcomm://mariadb0.weave.local,mariadb1.weave.local,mariadb2.weave.local,mariadb3.weave.local \
        --wsrep_sst_auth="root:PM7%cB43$sd@^1" \
        --wsrep_node_address=mariadb1.weave.local

Take note that if --memory-swap is set to the same value as --memory, and --memory is set to a positive integer, the container will not have access to swap. If --memory-swap is not set, container swap will default to --memory multiply by 2. If --memory and --memory-swap are set to the same value, this will prevent containers from using any swap. This is because --memory-swap is the amount of combined memory and swap that can be used, while --memory is only the amount of physical memory that can be used.

Some of the container resources like memory and CPU can be controlled dynamically through "docker update" command, as shown in the following example to upgrade the memory of container mariadb1 to 32G on-the-fly:

$ docker update \
    --memory 32g \
    --memory-swap 32g \
    mariadb1

Do not forget to tune the my.cnf accordingly to suit the new specs. Configuration management is explained in the next section.

Configuration Management

Most of the MySQL/MariaDB configuration parameters can be changed during runtime, which means you don't need to restart to apply the changes. Check out the MariaDB documentation page for details. The parameter listed with "Dynamic: Yes" means the variable is loaded immediately upon changing without the necessity to restart MariaDB server. Otherwise, set the parameters inside the custom configuration file in the Docker host. For example, on mariadb3, make the changes to the following file:

$ vim /containers/mariadb3/conf.d/my.cnf

And then restart the database container to apply the change:

$ docker restart mariadb3

Verify the container starts up the process by looking at the docker logs. Perform this operation on one node at a time if you would like to make cluster-wide changes.

Backup

Taking a logical backup is pretty straightforward because the MariaDB image also comes with mysqldump binary. You simply use the "docker exec" command to run the mysqldump and send the output to a file relative to the host path. The following command performs mysqldump backup on mariadb2 and saves it to /backups/mariadb2 inside host2:

$ docker exec -it mariadb2 mysqldump -uroot -p --single-transaction > /backups/mariadb2/dump.sql

Binary backup like Percona Xtrabackup or MariaDB Backup requires the process to access the MariaDB data directory directly. You have to either install this tool inside the container, or through the machine host or use a dedicated image for this purpose like "perconalab/percona-xtrabackup" image to create the backup and stored it inside /tmp/backup on the Docker host:

$ docker run --rm -it \
    -v /containers/mariadb2/datadir:/var/lib/mysql \
    -v /tmp/backup:/xtrabackup_backupfiles \
    perconalab/percona-xtrabackup \
    --backup --host=mariadb2 --user=root --password=mypassword

You can also stop the container with innodb_fast_shutdown set to 0 and copy over the datadir volume to another location in the physical host:

$ docker exec -it mariadb2 mysql -uroot -p -e 'SET GLOBAL innodb_fast_shutdown = 0'
$ docker kill -s 15 mariadb2
$ cp -Rf /containers/mariadb2/datadir /backups/mariadb2/datadir_copied
$ docker start mariadb2

Restore

Restoring is pretty straightforward for mysqldump. You can simply redirect the stdin into the container from the physical host:

$ docker exec -it mariadb2 mysql -uroot -p < /backups/mariadb2/dump.sql

You can also use the standard mysql client command line remotely with proper hostname and port value instead of using this "docker exec" command:

$ mysql -uroot -p -h127.0.0.1 -P3306 < /backups/mariadb2/dump.sql

For Percona Xtrabackup and MariaDB Backup, we have to prepare the backup beforehand. This will roll forward the backup to the time when the backup was finished. Let's say our Xtrabackup files are located under /tmp/backup of the Docker host, to prepare it, simply:

$ docker run --rm -it \
    -v mysql-datadir:/var/lib/mysql \
    -v /tmp/backup:/xtrabackup_backupfiles \
    perconalab/percona-xtrabackup \
    --prepare --target-dir /xtrabackup_backupfiles

The prepared backup under /tmp/backup of the Docker host then can be used as the MariaDB datadir for a new container or cluster. Let's say we just want to verify restoration on a standalone MariaDB container, we would run:

$ docker run -d \
    --name mariadb-restored \
    --env MYSQL_ROOT_PASSWORD="PM7%cB43$sd@^1" \
    -v /tmp/backup:/var/lib/mysql \
    mariadb:10.2.15

If you performed a backup using stop and copy approach, you can simply duplicate the datadir and use the duplicated directory as a volume maps to MariaDB datadir to run on another container. Let's say the backup was copied over under /backups/mariadb2/datadir_copied, we can run a new container by running:

$ mkdir -p /containers/mariadb-restored/datadir
$ cp -Rf /backups/mariadb2/datadir_copied /containers/mariadb-restored/datadir
$ docker run -d \
    --name mariadb-restored \
    --env MYSQL_ROOT_PASSWORD="PM7%cB43$sd@^1" \
    -v /containers/mariadb-restored/datadir:/var/lib/mysql \
    mariadb:10.2.15

The MYSQL_ROOT_PASSWORD must match the actual root password for that particular backup.

Severalnines
 
MySQL on Docker: How to Containerize Your Database
Discover all you need to understand when considering to run a MySQL service on top of Docker container virtualization

Database Version Upgrade

There are two types of upgrade - in-place upgrade or logical upgrade.

In-place upgrade involves shutting down the MariaDB server, replacing the old binaries with the new binaries and then starting the server on the old data directory. Once started, you have to run mysql_upgrade script to check and upgrade all system tables and also to check the user tables.

The logical upgrade involves exporting SQL from the current version using a logical backup utility such as mysqldump, running the new container with the upgraded version binaries, and then applying the SQL to the new MySQL/MariaDB version. It is similar to backup and restore approach described in the previous section.

Nevertheless, it's a good approach to always backup your database before performing any destructive operations. The following steps are required when upgrading from the current image, MariaDB 10.1.33 to another major version, MariaDB 10.2.15 on mariadb3 resides on host3:

  1. Backup the database. It doesn't matter physical or logical backup but the latter using mysqldump is recommended.

  2. Download the latest image that we would like to upgrade to:

    $ docker pull mariadb:10.2.15
  3. Set innodb_fast_shutdown to 0 for our database container:

    $ docker exec -it mariadb3 mysql -uroot -p -e 'SET GLOBAL innodb_fast_shutdown = 0'
  4. Graceful shut down the database container:

    $ docker kill --signal=TERM mariadb3
  5. Create a new container with the new image for our database container. Keep the rest of the parameters intact except using the new container name (otherwise it would conflict):

    $ docker run -d \
            --name mariadb3-new \
            --hostname mariadb3.weave.local \
            --net weave \
            --publish "3306:3306" \
            --publish "4444" \
            --publish "4567" \
            --publish "4568" \
            $(weave dns-args) \
            --env MYSQL_ROOT_PASSWORD="PM7%cB43$sd@^1" \
            --volume /containers/mariadb3/datadir:/var/lib/mysql \
            --volume /containers/mariadb3/conf.d:/etc/mysql/mariadb.conf.d \
            mariadb:10.2.15 \
            --wsrep_cluster_address=gcomm://mariadb0.weave.local,mariadb1.weave.local,mariadb2.weave.local,mariadb3.weave.local \
            --wsrep_sst_auth="root:PM7%cB43$sd@^1" \
            --wsrep_node_address=mariadb3.weave.local
  6. Run mysql_upgrade script:

    $ docker exec -it mariadb3-new mysql_upgrade -uroot -p
  7. If no errors occurred, remove the old container, mariadb3 (the new one is mariadb3-new):

    $ docker rm -f mariadb3
  8. Otherwise, if the upgrade process fails in between, we can fall back to the previous container:

    $ docker stop mariadb3-new
    $ docker start mariadb3

Major version upgrade can be performed similarly to the minor version upgrade, except you have to keep in mind that MySQL/MariaDB only supports major upgrade from the previous version. If you are on MariaDB 10.0 and would like to upgrade to 10.2, you have to upgrade to MariaDB 10.1 first, followed by another upgrade step to MariaDB 10.2.

Take note on the configuration changes being introduced and deprecated between major versions.

Failover

In Galera, all nodes are masters and hold the same role. With ProxySQL in the picture, connections that pass through this gateway will be failed over automatically as long as there is a primary component running for Galera Cluster (that is, a majority of nodes are up). The application won't notice any difference if one database node goes down because ProxySQL will simply redirect the connections to the other available nodes.

If the application connects directly to the MariaDB bypassing ProxySQL, failover has to be performed on the application-side by pointing to the next available node, provided the database node meets the following conditions:

  • Status wsrep_local_state_comment is Synced (The state "Desynced/Donor" is also possible, only if wsrep_sst_method is xtrabackup, xtrabackup-v2 or mariabackup).
  • Status wsrep_cluster_status is Primary.

In Galera, an available node doesn't mean it's healthy until the above status are verified.

Scaling Out

To scale out, we can create a new container in the same network and use the same custom configuration file for the existing container on that particular host. For example, let's say we want to add the fourth MariaDB container on host3, we can use the same configuration file mounted for mariadb3, as illustrated in the following diagram:

Run the following command on host3 to scale out:

$ docker run -d \
        --name mariadb4 \
        --hostname mariadb4.weave.local \
        --net weave \
        --publish "3306:3307" \
        --publish "4444" \
        --publish "4567" \
        --publish "4568" \
        $(weave dns-args) \
        --env MYSQL_ROOT_PASSWORD="PM7%cB43$sd@^1" \
        --volume /containers/mariadb4/datadir:/var/lib/mysql \
        --volume /containers/mariadb3/conf.d:/etc/mysql/mariadb.conf.d \
        mariadb:10.2.15 \
        --wsrep_cluster_address=gcomm://mariadb1.weave.local,mariadb2.weave.local,mariadb3.weave.local,mariadb4.weave.local \
        --wsrep_sst_auth="root:PM7%cB43$sd@^1" \
        --wsrep_node_address=mariadb4.weave.local

Once the container is created, it will join the cluster and perform SST. It can be accessed on port 3307 externally or outside of the Weave network, or port 3306 within the host or within the Weave network. It's not necessary to include mariadb0.weave.local into the cluster address anymore. Once the cluster is scaled out, we need to add the new MariaDB container into the ProxySQL load balancing set via admin console:

$ docker exec -it proxysql1 mysql -uadmin -padmin -P6032
mysql> INSERT INTO mysql_servers(hostgroup_id,hostname,port) VALUES (10,'mariadb4.weave.local',3306);
mysql> INSERT INTO mysql_servers(hostgroup_id,hostname,port) VALUES (20,'mariadb4.weave.local',3306);
mysql> LOAD MYSQL SERVERS TO RUNTIME;
mysql> SAVE MYSQL SERVERS TO DISK;

Repeat the above commands on the second ProxySQL instance.

Finally for the the last step, (you may skip this part if you already ran "SAVE .. TO DISK" statement in ProxySQL), add the following line into proxysql.cnf to make it persistent across container restart on host1 and host2:

$ vim /containers/proxysql1/proxysql.cnf # host1
$ vim /containers/proxysql2/proxysql.cnf # host2

And append mariadb4 related lines under mysql_server directive:

mysql_servers =
(
        { address="mariadb1.weave.local" , port=3306 , hostgroup=10, max_connections=100 },
        { address="mariadb2.weave.local" , port=3306 , hostgroup=10, max_connections=100 },
        { address="mariadb3.weave.local" , port=3306 , hostgroup=10, max_connections=100 },
        { address="mariadb4.weave.local" , port=3306 , hostgroup=10, max_connections=100 },
        { address="mariadb1.weave.local" , port=3306 , hostgroup=20, max_connections=100 },
        { address="mariadb2.weave.local" , port=3306 , hostgroup=20, max_connections=100 },
        { address="mariadb3.weave.local" , port=3306 , hostgroup=20, max_connections=100 },
        { address="mariadb4.weave.local" , port=3306 , hostgroup=20, max_connections=100 }
)

Save the file and we should be good on the next container restart.

Scaling Down

To scale down, simply shuts down the container gracefully. The best command would be:

$ docker kill -s 15 mariadb4
$ docker rm -f mariadb4

Remember, if the database node left the cluster ungracefully, it was not part of scaling down and would affect the quorum calculation.

To remove the container from ProxySQL, run the following commands on both ProxySQL containers. For example, on proxysql1:

$ docker exec -it proxysql1 mysql -uadmin -padmin -P6032
mysql> DELETE FROM mysql_servers WHERE hostname="mariadb4.weave.local";
mysql> LOAD MYSQL SERVERS TO RUNTIME;
mysql> SAVE MYSQL SERVERS TO DISK;

You can then either remove the corresponding entry inside proxysql.cnf or just leave it like that. It will be detected as OFFLINE from ProxySQL point-of-view anyway.

Summary

With Docker, things get a bit different from the conventional way on handling MySQL or MariaDB servers. Handling stateful services like Galera Cluster is not as easy as stateless applications, and requires proper testing and planning.

In our next blog on this topic, we will evaluate the pros and cons of running Galera Cluster on Docker without any orchestration tools.

Schema Management Tips for MySQL & MariaDB

$
0
0

Database schema is not something that is written in stone. It is designed for a given application, but then the requirements may and usually do change. New modules and functionalities are added to the application, more data is collected, code and data model refactoring is performed. Thereby the need to modify the database schema to adapt to these changes; adding or modifying columns, creating new tables or partitioning large ones. Queries change too as developers add new ways for users to interact with the data - new queries could use new, more efficient indexes so we rush to create them in order to provide the application with the best database performance.

So, how do we best approach a schema change? What tools are useful? How to minimize the impact on a production database? What are the most common issues with schema design? What tools can help you to stay on top of your schema? In this blog post we will give you a short overview of how to do schema changes in MySQL and MariaDB. Please note that we will not discuss schema changes in the context of Galera Cluster. We already discussed Total Order Isolation, Rolling Schema Upgrades and tips to minimize impact from RSU in previous blog posts. We will also discuss tips and tricks related to schema design and how ClusterControl can help you to stay on top of all schema changes.

Types of Schema Changes

First things first. Before we dig into the topic, we have to understand how MySQL and MariaDB perform schema changes. You see, one schema change is not equal to another schema change.

You may have heard about online alters, instant alters or in-place alters. All of this is a result of work which is ongoing to minimize the impact of the schema changes on the production database. Historically, almost all schema changes were blocking. If you executed a schema change, all of the queries will start to pile up, waiting for the ALTER to complete. Obviously, this posed serious issues for production deployments. Sure, people immediately start to look for workarounds, and we will discuss them later in this blog, as even today those are still relevant. But also, work started to improve capability of MySQL to run DDL’s (Data Definition Language) without much impact to other queries.

Instant Changes

Sometimes it is not needed to touch any data in the tablespace, because all that has to be changed is the metadata. An example here will be dropping an index or renaming a column. Such operations are quick and efficient. Typically, their impact is limited. It is not without any impact, though. Sometimes it takes couple of seconds to perform the change in the metadata and such change requires a metadata lock to be acquired. This lock is on a per-table basis, and it may block other operations which are to be executed on this table. You’ll see this as “Waiting for table metadata lock” entries in the processlist.

An example of such change may be instant ADD COLUMN, introduced in MariaDB 10.3 and MySQL 8.0. It gives the possibility to execute this quite popular schema change without any delay. Both MariaDB and Oracle decided to include code from Tencent Game which allows to instantly add a new column to the table. This is under some specific conditions; column has to be added as the last one, full text indexes cannot exist in the table, row format cannot be compressed - you can find more information on how instant add column works in MariaDB documentation. For MySQL, the only official reference can be found on mysqlserverteam.com blog, although a bug exists to update the official documentation.

In Place Changes

Some of the changes require modification of the data in the tablespace. Such modifications can be performed on the data itself, and there’s no need to create a temporary table with a new data structure. Such changes, typically (although not always) allow other queries touching the table to be executed while the schema change is running. An example of such operation is to add a new secondary index to the table. This operation will take some time to perform but will allow DML’s to be executed.

Table Rebuild

If it is not possible to make a change in place, InnoDB will create a temporary table with the new, desired structure. It will then copy existing data to the new table. This operation is the most expensive one and it is likely (although it doesn’t always happen) to lock the DML’s. As a result, such schema change is very tricky to execute on a large table on a standalone server, without help of external tools - typically you cannot afford to have your database locked for long minutes or even hours. An example of such operation would be to change the column data type, for example from INT to VARCHAR.

Schema Changes and Replication

Ok, so we know that InnoDB allow online schema changes and if we consult MySQL documentation, we will see that the majority of the schema changes (at least among the most common ones) can be performed online. What is the reason behind dedicating hours of development to create online schema change tools like gh-ost? We can accept that pt-online-schema-change is a remnant of the old, bad times but gh-ost is a new software.

The answer is complex. There are two main issues.

For starters, once you start a schema change, you do not have control over it. You can abort it but you cannot pause it. You cannot throttle it. As you can imagine, rebuilding the table is an expensive operation and even if InnoDB allows DML’s to be executed, additional I/O workload from the DDL affects all other queries and there’s no way to limit this impact to a level that is acceptable to the application.

Second, even more serious issue, is replication. If you execute a non-blocking operation, which requires a table rebuild, it will indeed not lock DML’s but this is true only on the master. Let’s assume such DDL took 30 minutes to complete - ALTER speed depends on the hardware but it is fairly common to see such execution times on tables of 20GB size range. It is then replicated to all slaves and, from the moment DDL starts on those slaves, replication will wait for it to complete. It does not matter if you use MySQL or MariaDB, or if you have multi-threaded replication. Slaves will lag - they will wait those 30 minutes for the DDL to complete before the commence applying the remaining binlog events. As you can imagine, 30 minutes of lag (sometimes even 30 seconds will be not acceptable - it all depends on the application) is something which makes impossible to use those slaves for scale-out. Of course, there are workarounds - you can perform schema changes from the bottom to the top of the replication chain but this seriously limits your options. Especially if you use row-based replication, you can only execute compatible schema changes this way. Couple of examples of limitations of row-based replication; you cannot drop any column which is not the last one, you cannot add a column into a position other than the last one. You cannot also change column type (for example, INT -> VARCHAR).

As you can see, replication adds complexity into how you can perform schema changes. Operations which are non-blocking on the standalone host become blocking while executed on slaves. Let’s take a look at couple of methods you can use to minimize the impact of schema changes.

Online Schema Change Tools

As we mentioned earlier, there are tools, which are intended to perform schema changes. The most popular ones are pt-online-schema-change created by Percona and gh-ost, created by GitHub. In a series of blog posts we compared them and discussed how gh-ost can be used to perform schema changes and how you can throttle and reconfigure an undergoing migration. Here we will not go into details, but we would still like to mention some of the most important aspects of using those tools. For starters, a schema change executed through pt-osc or gh-ost will happen on all database nodes at once. There is no delay whatsoever in terms of when the change will be applied. This makes it possible to use those tools even for schema changes that are incompatible with row-based replication. The exact mechanisms about how those tools track changes on the table is different (triggers in pt-osc vs. binlog parsing in gh-ost) but the main idea is the same - a new table is created with the desired schema and existing data is copied from the old table. In the meantime, DML’s are tracked (one way or the other) and applied to the new table. Once all the data is migrated, tables are renamed and the new table replaces the old one. This is atomic operation so it is not visible to the application. Both tools have an option to throttle the load and pause the operations. Gh-ost can stop all of the activity, pt-osc only can stop the process of copying data between old and new table - triggers will stay active and they will continue duplicating data, which adds some overhead. Due to the rename table, both tools have some limitations regarding foreign keys - not supported by gh-ost, partially supported by pt-osc either through regular ALTER, which may cause replication lag (not feasible if the child table is large) or by dropping the old table before renaming the new one - it’s dangerous as there’s no way to rollback if, for some reason, data wasn’t copied to the new table correctly. Triggers are also tricky to support.

They are not supported in gh-ost, pt-osc in MySQL 5.7 and newer has limited support for tables with existing triggers. Other important limitations for online schema change tools is that unique or primary key has to exist in the table. It is used to identify rows to copy between old and new tables. Those tools are also much slower than direct ALTER - a change which takes hours while running ALTER may take days when performed using pt-osc or gh-ost.

On the other hand, as we mentioned, as long as the requirements are satisfied and limitations won’t come into play, you can run all schema changes utilizing one of the tools. All will happen at the same time on all hosts thus you don’t have to worry about compatibility. You have also some level of control over how the process is executed (less in pt-osc, much more in gh-ost).

You can reduce the impact of the schema change, you can pause them and let them run only under supervision, you can test the change before actually performing it. You can have them track replication lag and pause should an impact be detected. This makes those tools a really great addition to the DBA’s arsenal while working with MySQL replication.

ClusterControl
Single Console for Your Entire Database Infrastructure
Find out what else is new in ClusterControl

Rolling Schema Changes

Typically, a DBA will use one of the online schema change tools. But as we discussed earlier, under some circumstances, they cannot be used and a direct alter is the only viable option. If we are talking about standalone MySQL, you have no choice - if the change is non-blocking, that’s good. If it is not, well, there’s nothing you can do about it. But then, not that many people run MySQL as single instances, right? How about replication? As we discussed earlier, direct alter on the master is not feasible - most of the cases it will cause lag on the slave and this may not be acceptable. What can be done, though, is to execute the change in a rolling fashion. You can start with slaves and, once the change is applied on all of them, promote one of the slaves as a new master, demote the old master to a slave and execute the change on it. Sure, the change has to be compatible but, to tell the truth, the most common cases where you cannot use online schema changes is because of a lack of primary or unique key. For all other cases, there is some sort of workaround, especially in pt-online-schema-change as gh-ost has more hard limitations. It is a workaround you would call “so so” or “far from ideal”, but it will do the job if you have no other option to pick from. What is also important, most of the limitations can be avoided if you monitor your schema and catch the issues before the table grows. Even if someone creates a table without a primary key, it is not a problem to run a direct alter which takes half a second or less, as the table is almost empty.

If it will grow, this will become a serious problem but it is up to the DBA to catch this kind of issues before they actually start to create problems. We will cover some tips and tricks on how to make sure you will catch such issues on time. We will also share generic tips on how to design your schemas.

Tips and Tricks

Schema Design

As we showed in this post, online schema change tools are quite important when working with a replication setup therefore it is quite important to make sure your schema is designed in such a way that it will not limit your options for performing schema changes. There are three important aspects. First, primary or unique key has to exist - you need to make sure there are no tables without a primary key in your database. You should monitor this on a regular basis, otherwise it may become a serious problem in the future. Second, you should seriously consider if using foreign keys is a good idea. Sure, they have their uses but they also add overhead to your database and they can make it problematic to use online schema change tools. Relations can be enforced by the application. Even if it means more work, it still may be a better idea than to start using foreign keys and be severely limited to which types of schema changes can be performed. Third, triggers. Same story as with foreign keys. They are a nice feature to have, but they can become a burden. You need to seriously consider if the gains from using them outweight the limitations they pose.

Tracking Schema Changes

Schema change management is not only about running schema changes. You also have to stay on top of your schema structure, especially if you are not the only one doing the changes.

ClusterControl provides users with tools to track some of the most common schema design issues. It can help you to track tables which do not have primary keys:

As we discussed earlier, catching such tables early is very important as primary keys have to be added using direct alter.

ClusterControl can also help you track duplicate indexes. Typically, you don’t want to have multiple indexes which are redundant. In the example above, you can see that there is an index on (k, c) and there’s also an index on (k). Any query which can use index created on column ‘k’ can also use a composite index created on columns (k, c). There are cases where it is beneficial to keep redundant indexes but you have to approach it on case by case basis. Starting from MySQL 8.0, it is possible to quickly test if an index is really needed or not. You can make a redundant index ‘invisible’ by running:

ALTER TABLE sbtest.sbtest1 ALTER INDEX k_1 INVISIBLE;

This will make MySQL ignore that index and, through monitoring, you can check if there was any negative impact on the performance of the database. If everything works as planned for some time (couple of days or even weeks), you can plan on removing the redundant index. In case you detected something is not right, you can always re-enable this index by running:

ALTER TABLE sbtest.sbtest1 ALTER INDEX k_1 VISIBLE;

Those operations are instant and the index is there all the time, and is still maintained - it’s only that it will not be taken into consideration by the optimizer. Thanks to this option, removing indexes in MySQL 8.0 will be much safer operation. In the previous versions, re-adding a wrongly removed index could take hours if not days on large tables.

ClusterControl can also let you know about MyISAM tables.

While MyISAM still may have its uses, you have to keep in mind that it is not a transactional storage engine. As such, it can easily introduce data inconsistency between nodes in a replication setup.

Another very useful feature of ClusterControl is one of the operational reports - a Schema Change Report.

In an ideal world, a DBA reviews, approves and implements all of the schema changes. Unfortunately, this is not always the case. Such review process just does not go well with agile development. In addition to that, Developer-to-DBA ratio typically is quite high which can also become a problem as DBA’s would struggle not to become a bottleneck. That’s why it is not uncommon to see schema changes performed outside of the DBA’s knowledge. Yet, the DBA is usually the one responsible for the database’s performance and stability. Thanks to the Schema Change Report, they can now keep track of the schema changes.

At first some configuration is needed. In a configuration file for a given cluster (/etc/cmon.d/cmon_X.cnf), you have to define on which host ClusterControl should track the changes and which schemas should be checked.

schema_change_detection_address=10.0.0.126
schema_change_detection_databases=sbtest

Once that’s done, you can schedule a report to be executed on a regular basis. An example output may be like below:

As you can see, two tables have changed since the previous run of the report. In the first one, a new composite index has been created on columns (k, c). In the second table, a column was added.

In the subsequent run we got information about new table, which was created without any index or primary key. Using this kind of info, we can easily act when it is needed and solve the issues before they actually start to become blockers.

Viewing all 365 articles
Browse latest View live