Quantcast
Channel: Severalnines - MariaDB
Viewing all 365 articles
Browse latest View live

How to Improve Performance of Galera Cluster for MySQL or MariaDB

$
0
0

Galera Cluster comes with many notable features that are not available in standard MySQL replication (or Group Replication); automatic node provisioning, true multi-master with conflict resolutions and automatic failover. There are also a number of limitations that could potentially impact cluster performance. Luckily, if you are not aware of these, there are workarounds. And if you do it right, you can minimize the impact of these limitations and improve overall performance.

We have previously covered many tips and tricks related to Galera Cluster, including running Galera on AWS Cloud. This blog post distinctly dives into the performance aspects, with examples on how to get the most out of Galera.

Replication Payload

A bit of introduction - Galera replicates writesets during the commit stage, transferring writesets from the originator node to the receiver nodes synchronously through the wsrep replication plugin. This plugin will also certify writesets on the receiver nodes. If the certification process passes, it returns OK to the client on the originator node and will be applied on the receiver nodes at a later time asynchronously. Else, the transaction will be rolled back on the originator node (returning error to the client) and the writesets that have been transferred to the receiver nodes will be discarded.

A writeset consists of write operations inside a transaction that changes the database state. In Galera Cluster, autocommit is default to 1 (enabled). Literally, any SQL statement executed in Galera Cluster will be enclosed as a transaction, unless you explicitly start with BEGIN, START TRANSACTION or SET autocommit=0. The following diagram illustrates the encapsulation of a single DML statement into a writeset:

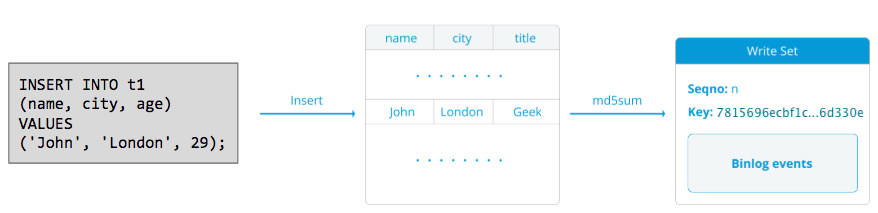
For DML (INSERT, UPDATE, DELETE..), the writeset payload consists of the binary log events for a particular transaction while for DDLs (ALTER, GRANT, CREATE..), the writeset payload is the DDL statement itself. For DMLs, the writeset will have to be certified against conflicts on the receiver node while for DDLs (depending on wsrep_osu_method, default to TOI), the cluster cluster runs the DDL statement on all nodes in the same total order sequence, blocking other transactions from committing while the DDL is in progress (see also RSU). In simple words, Galera Cluster handles DDL and DML replication differently.

Round Trip Time

Generally, the following factors determine how fast Galera can replicate a writeset from an originator node to all receiver nodes:

  • Round trip time (RTT) to the farthest node in the cluster from the originator node.
  • The size of a writeset to be transferred and certified for conflict on the receiver node.

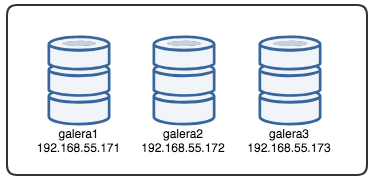
For example, if we have a three-node Galera Cluster and one of the nodes is located 10 milliseconds away (0.01 second), it's very unlikely you might be able to write more than 100 times per second to the same row without conflicting. There is a popular quote from Mark Callaghan which describes this behaviour pretty well:

"[In a Galera cluster] a given row can’t be modified more than once per RTT"

To measure RTT value, simply perform ping on the originator node to the farthest node in the cluster:

$ ping 192.168.55.173 # the farthest node

Wait for a couple of seconds (or minutes) and terminate the command. The last line of the ping statistic section is what we are looking for:

--- 192.168.55.172 ping statistics ---
65 packets transmitted, 65 received, 0% packet loss, time 64019ms
rtt min/avg/max/mdev = 0.111/0.431/1.340/0.240 ms

The max value is 1.340 ms (0.00134s) and we should take this value when estimating the minimum transactions per second (tps) for this cluster. The average value is 0.431ms (0.000431s) and we can use to estimate the average tps while min value is 0.111ms (0.000111s) which we can use to estimate the maximum tps. The mdev means how the RTT samples were distributed from the average. Lower value means more stable RTT.

Hence, transactions per second can be estimated by dividing RTT (in second) into 1 second:

Resulting,

  • Minimum tps: 1 / 0.00134 (max RTT) = 746.26 ~ 746 tps
  • Average tps: 1 / 0.000431 (avg RTT) = 2320.19 ~ 2320 tps
  • Maximum tps: 1 / 0.000111 (min RTT) = 9009.01 ~ 9009 tps

Note that this is just an estimation to anticipate replication performance. There is not much we can do to improve this on the database side, once we have everything deployed and running. Except, if you move or migrate the database servers closer to each other to improve the RTT between nodes, or upgrade the network peripherals or infrastructure. This would require maintenance window and proper planning.

Chunk Up Big Transactions

Another factor is the transaction size. After the writeset is transferred, there will be a certification process. Certification is a process to determine whether or not the node can apply the writeset. Galera generates MD5 checksum pseudo keys from every full row. The cost of certification depends on the size of the writeset, which translates into a number of unique key lookups into the certification index (a hash table). If you update 500,000 rows in a single transaction, for example:

# a 500,000 rows table
mysql> UPDATE mydb.settings SET success = 1;

The above will generate a single writeset with 500,000 binary log events in it. This huge writeset does not exceed wsrep_max_ws_size (default to 2GB) so it will be transferred over by Galera replication plugin to all nodes in the cluster, certifying these 500,000 rows on the receiver nodes for any conflicting transactions that are still in the slave queue. Finally, the certification status is returned to the group replication plugin. The bigger the transaction size, the higher risk it will be conflicting with other transactions that come from another master. Conflicting transactions waste server resources, plus cause a huge rollback to the originator node. Note that a rollback operation in MySQL is way slower and less optimized than commit operation.

The above SQL statement can be re-written into a more Galera-friendly statement with the help of simple loop, like the example below:

(bash)$ for i in {1..500}; do \
mysql -uuser -ppassword -e "UPDATE mydb.settings SET success = 1 WHERE success != 1 LIMIT 1000"; \
sleep 2; \
done

The above shell command would update 1000 rows per transaction for 500 times and wait for 2 seconds between executions. You could also use a stored procedure or other means to achieve a similar result. If rewriting the SQL query is not an option, simply instruct the application to execute the big transaction during a maintenance window to reduce the risk of conflicts.

For huge deletes, consider using pt-archiver from the Percona Toolkit - a low-impact, forward-only job to nibble old data out of the table without impacting OLTP queries much.

Parallel Slave Threads

In Galera, the applier is a multithreaded process. Applier is a thread running within Galera to apply the incoming write-sets from another node. Which means, it is possible for all receivers to execute multiple DML operations that come right from the originator (master) node simultaneously. Galera parallel replication is only applied to transactions when it is safe to do so. It improves the probability of the node to sync up with the originator node. However, the replication speed is still limited to RTT and writeset size.

To get the best out of this, we need to know two things:

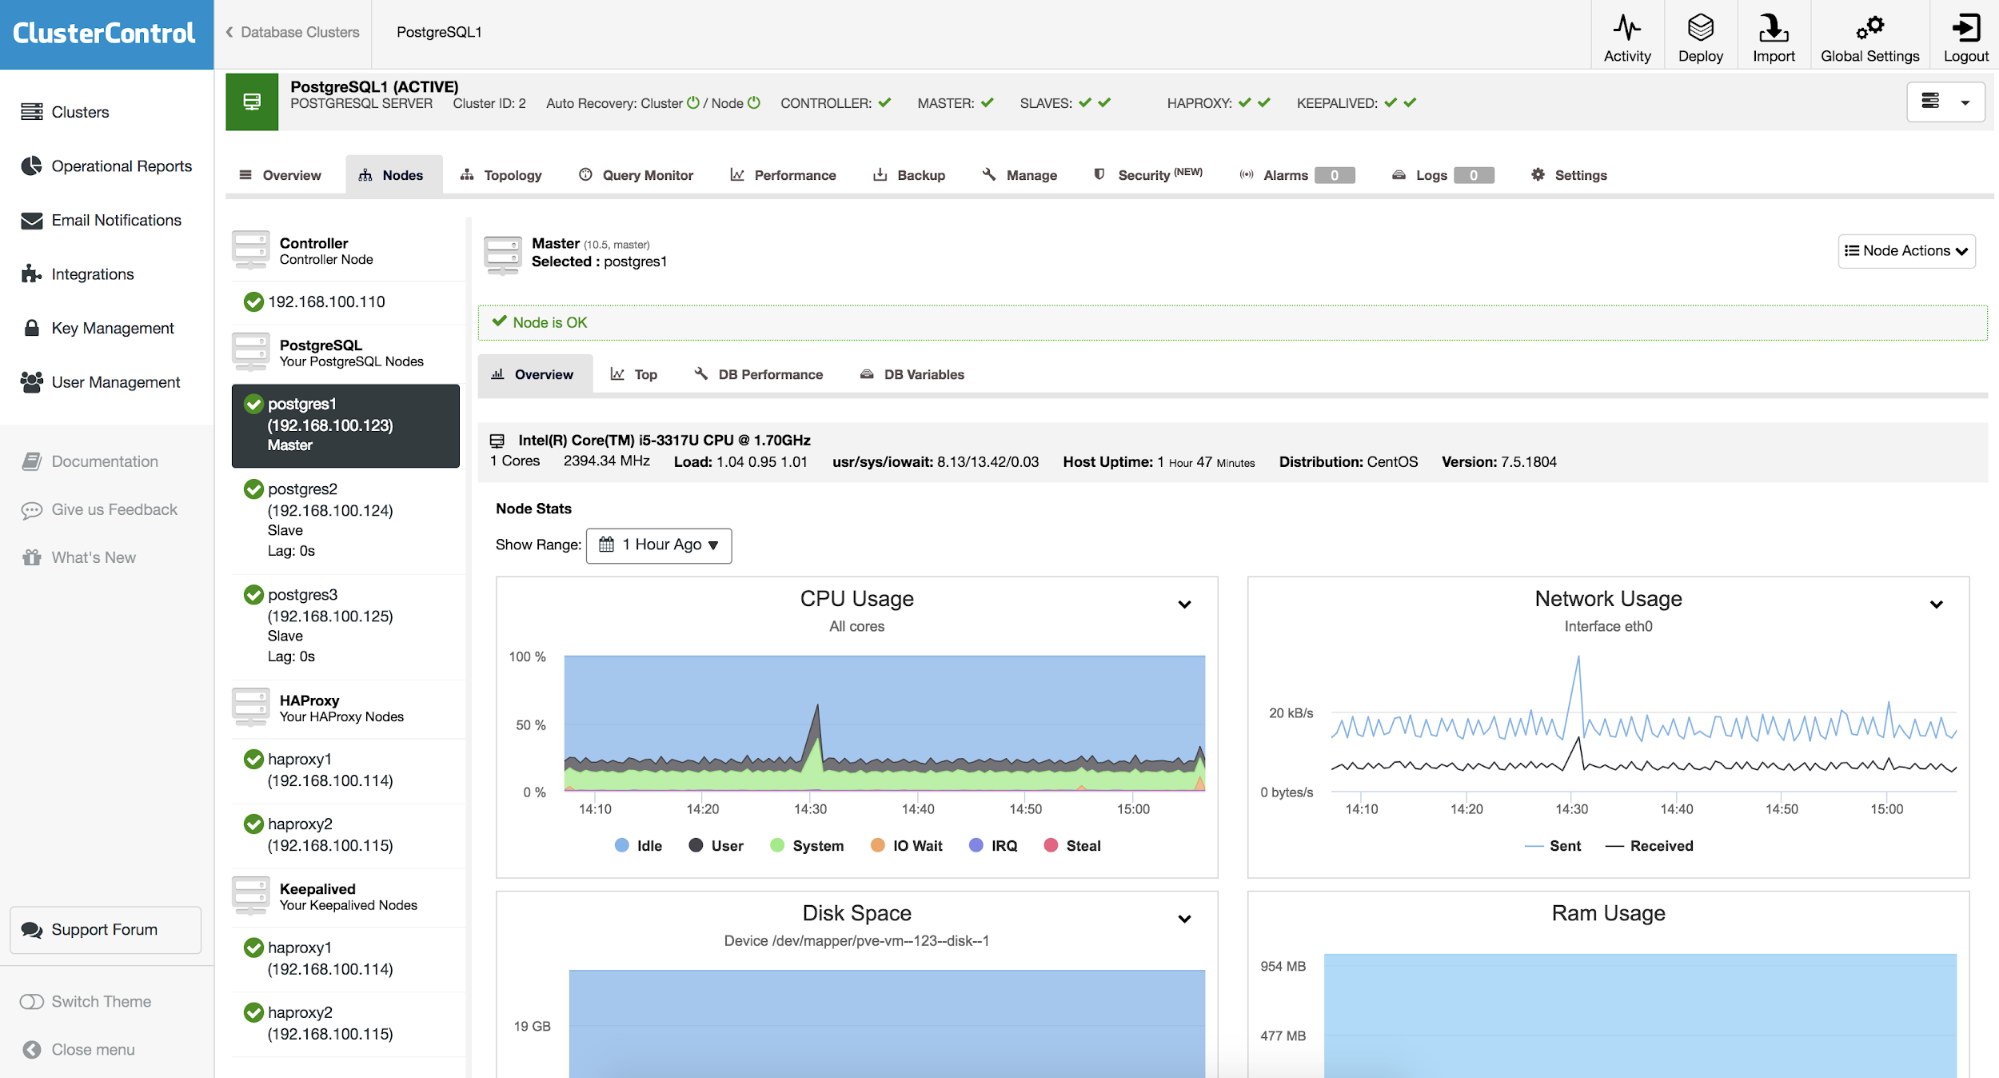
  • The number of cores the server has.
  • The value of wsrep_cert_deps_distance status.

The status wsrep_cert_deps_distance tells us the potential degree of parallelization. It is the value of the average distance between highest and lowest seqno values that can be possibly applied in parallel. You can use the wsrep_cert_deps_distance status variable to determine the maximum number of slave threads possible. Take note that this is an average value across time. Hence, in order get a good value, you have to hit the cluster with writes operations through test workload or benchmark until you see a stable value coming out.

To get the number of cores, you can simply use the following command:

$ grep -c processor /proc/cpuinfo
4

Ideally, 2, 3 or 4 threads of slave applier per CPU core is a good start. Thus, the minimum value for the slave threads should be 4 x number of CPU cores, and must not exceed the wsrep_cert_deps_distance value:

MariaDB [(none)]> SHOW STATUS LIKE 'wsrep_cert_deps_distance';
+--------------------------+----------+
| Variable_name            | Value    |
+--------------------------+----------+
| wsrep_cert_deps_distance | 48.16667 |
+--------------------------+----------+

You can control the number of slave applier threads using wsrep_slave_thread variable. Even though this is a dynamic variable, only increasing the number would have an immediate effect. If you reduce the value dynamically, it would take some time, until the applier thread exits after it finishes applying. A recommended value is anywhere between 16 to 48:

mysql> SET GLOBAL wsrep_slave_threads = 48;

Take note that in order for parallel slave threads to work, the following must be set (which is usually pre-configured for Galera Cluster):

innodb_autoinc_lock_mode=2

Galera Cache (gcache)

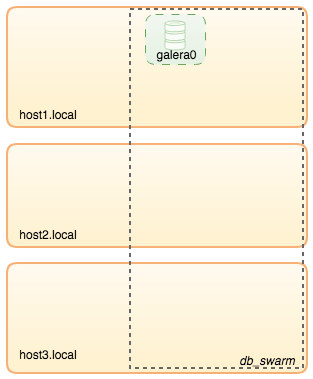
Galera uses a preallocated file with a specific size called gcache, where a Galera node keeps a copy of writesets in circular buffer style. By default, its size is 128MB, which is rather small. Incremental State Transfer (IST) is a method to prepare a joiner by sending only the missing writesets available in the donor’s gcache. IST is faster than state snapshot transfer (SST), it is non-blocking and has no significant performance impact on the donor. It should be the preferred option whenever possible.

IST can only be achieved if all changes missed by the joiner are still in the gcache file of the donor. The recommended setting for this is to be as big as the whole MySQL dataset. If disk space is limited or costly, determining the right size of the gcache size is crucial, as it can influence the data synchronization performance between Galera nodes.

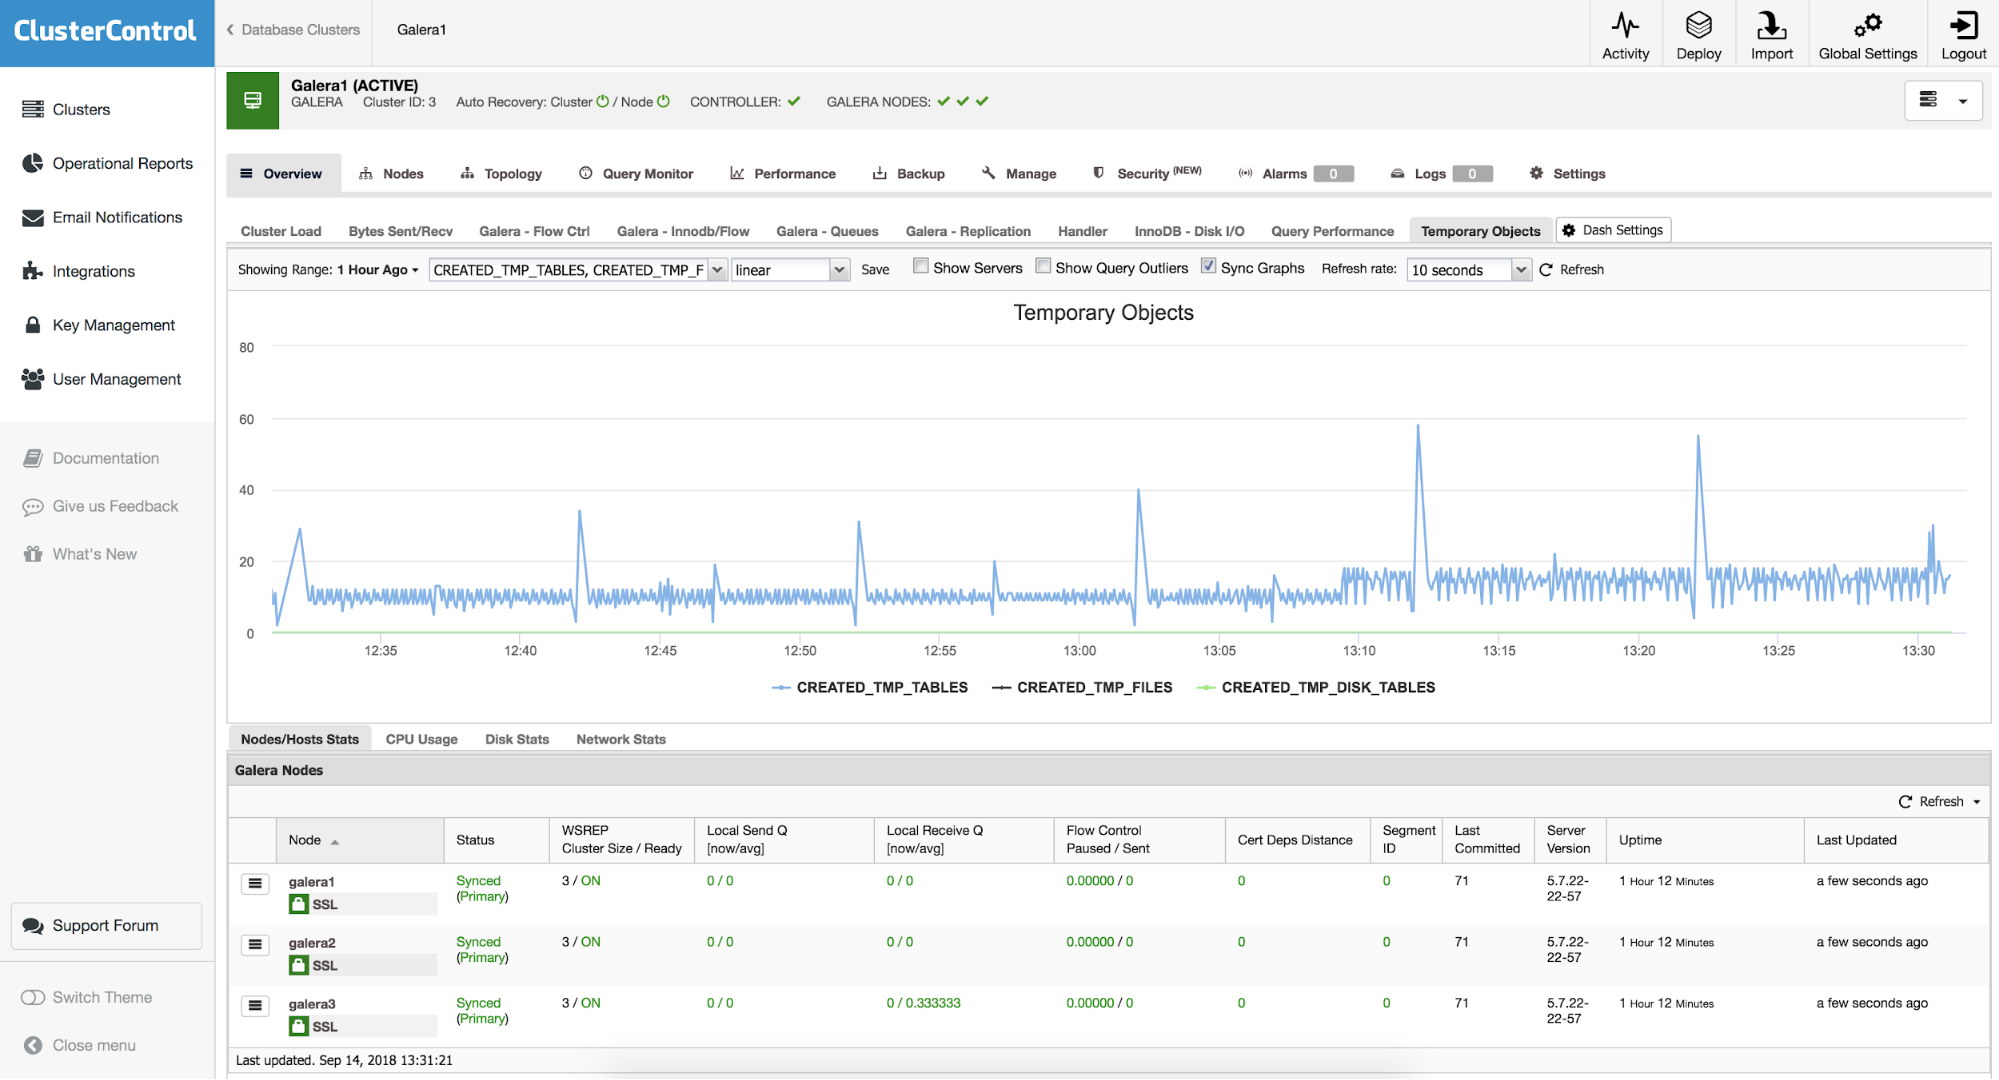
The below statement will give us an idea of the amount of data replicated by Galera. Run the following statement on one of the Galera nodes during peak hours (tested on MariaDB >10.0 and PXC >5.6, galera >3.x):

mysql> SET @start := (SELECT SUM(VARIABLE_VALUE/1024/1024) FROM information_schema.global_status WHERE VARIABLE_NAME LIKE 'WSREP%bytes'); do sleep(60); SET @end := (SELECT SUM(VARIABLE_VALUE/1024/1024) FROM information_schema.global_status WHERE VARIABLE_NAME LIKE 'WSREP%bytes'); SET @gcache := (SELECT SUBSTRING_INDEX(SUBSTRING_INDEX(@@GLOBAL.wsrep_provider_options,'gcache.size = ',-1), 'M', 1)); SELECT ROUND((@end - @start),2) AS `MB/min`, ROUND((@end - @start),2) * 60 as `MB/hour`, @gcache as `gcache Size(MB)`, ROUND(@gcache/round((@end - @start),2),2) as `Time to full(minutes)`;
+--------+---------+-----------------+-----------------------+
| MB/min | MB/hour | gcache Size(MB) | Time to full(minutes) |
+--------+---------+-----------------+-----------------------+
|   7.95 |  477.00 |  128            |                 16.10 |
+--------+---------+-----------------+-----------------------+

We can estimate that the Galera node can have approximately 16 minutes of downtime, without requiring SST to join (unless Galera cannot determine the joiner state). If this is too short time and you have enough disk space on your nodes, you can change the wsrep_provider_options="gcache.size=<value>" to a more appropriate value. In this example workload, setting gcache.size=1G allows us to have 2 hours of node downtime with high probability of IST when the node rejoins.

It's also recommended to use gcache.recover=yes in wsrep_provider_options (Galera >3.19), where Galera will attempt to recover the gcache file to a usable state on startup rather than delete it, thus preserving the ability to have IST and avoiding SST as much as possible. Codership and Percona have covered this in details in their blogs. IST is always the best method to sync up after a node rejoins the cluster. It is 50% faster than xtrabackup or mariabackup and 5x faster than mysqldump.
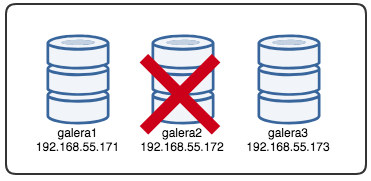
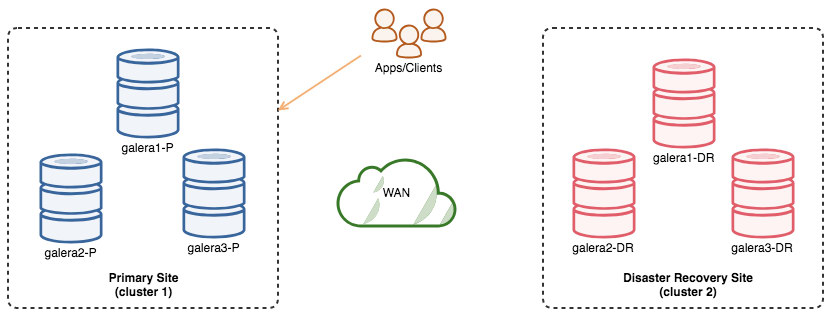
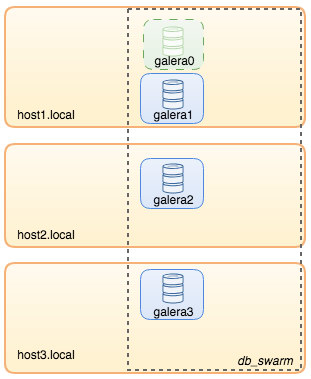
Asynchronous Slave

Galera nodes are tightly-coupled, where the replication performance is as fast as the slowest node. Galera use a flow control mechanism, to control replication flow among members and eliminate any slave lag. The replication can be all fast or all slow on every node and is adjusted automatically by Galera. If you want to know about flow control, read this blog post by Jay Janssen from Percona.

In most cases, heavy operations like long running analytics (read-intensive) and backups (read-intensive, locking) are often inevitable, which could potentially degrade the cluster performance. The best way to execute this type of queries is by sending them to a loosely-coupled replica server, for instance, an asynchronous slave.

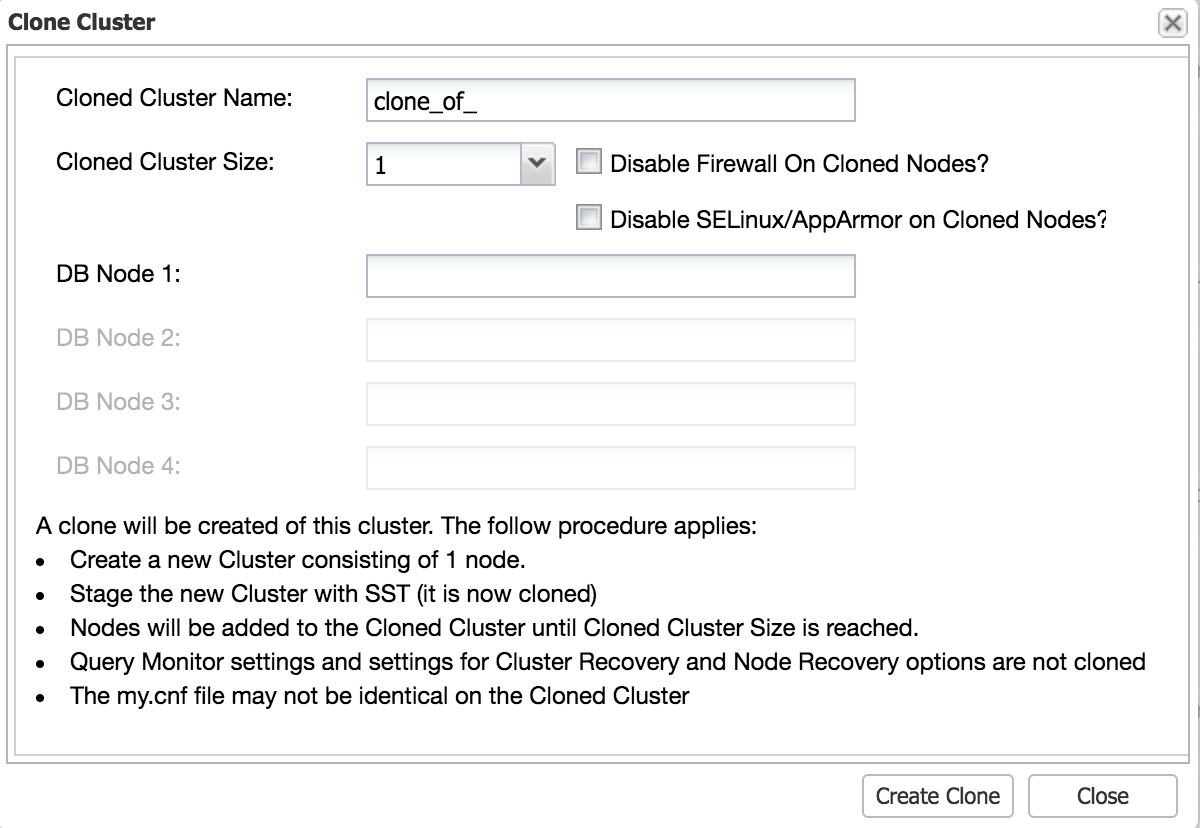
An asynchronous slave replicates from a Galera node using the standard MySQL asynchronous replication protocol. There is no limit on the number of slaves that can be connected to one Galera node, and chaining it out with an intermediate master is also possible. MySQL operations that execute on this server won't impact the cluster performance, apart from the initial syncing phase where a full backup must be taken on the Galera node to stage the slave before establishing the replication link (although ClusterControl allows you to build the async slave from an existing backup first, before connecting it to the cluster).

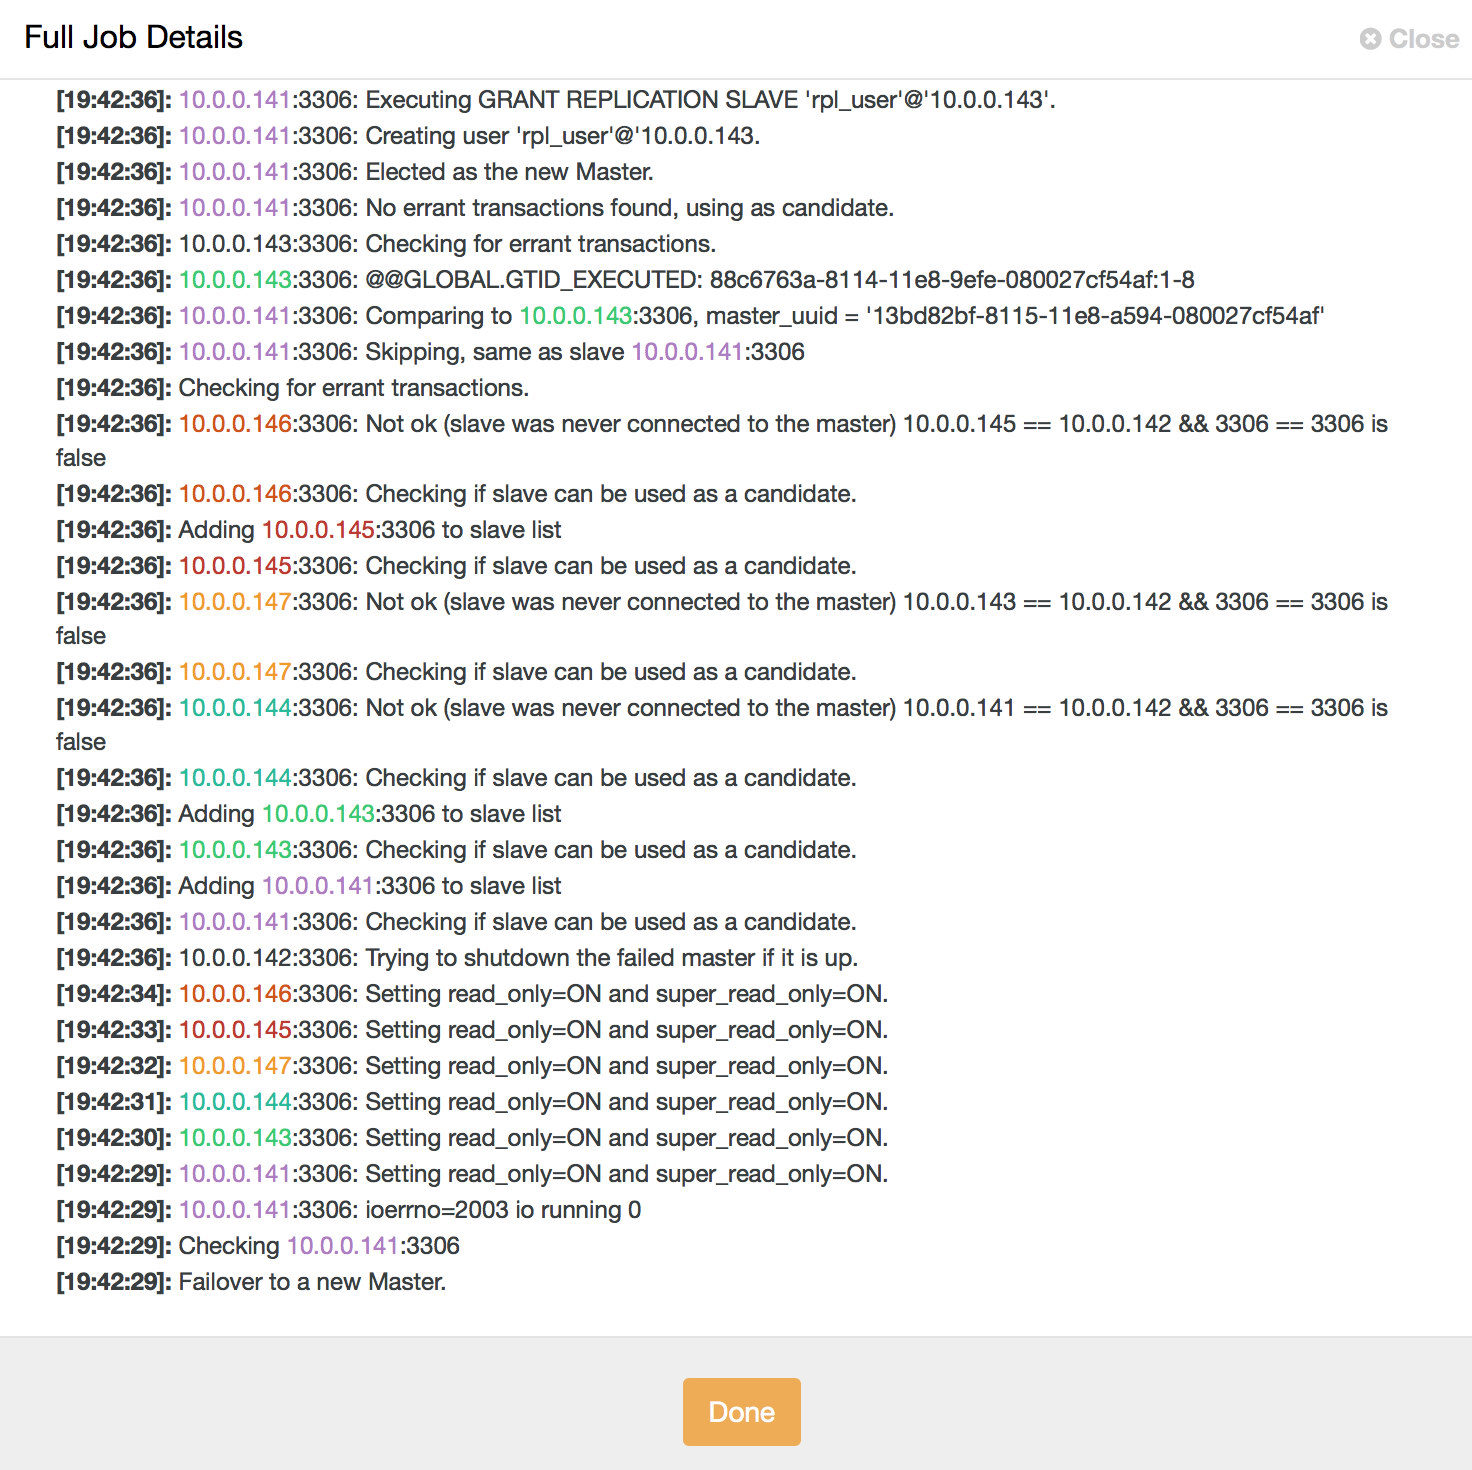
GTID (Global Transaction Identifier) provides a better transactions mapping across nodes, and is supported in MySQL 5.6 and MariaDB 10.0. With GTID, the failover operation on a slave to another master (another Galera node) is simplified, without the need to figure out the exact log file and position. Galera also comes with its own GTID implementation but these two are independent to each other.

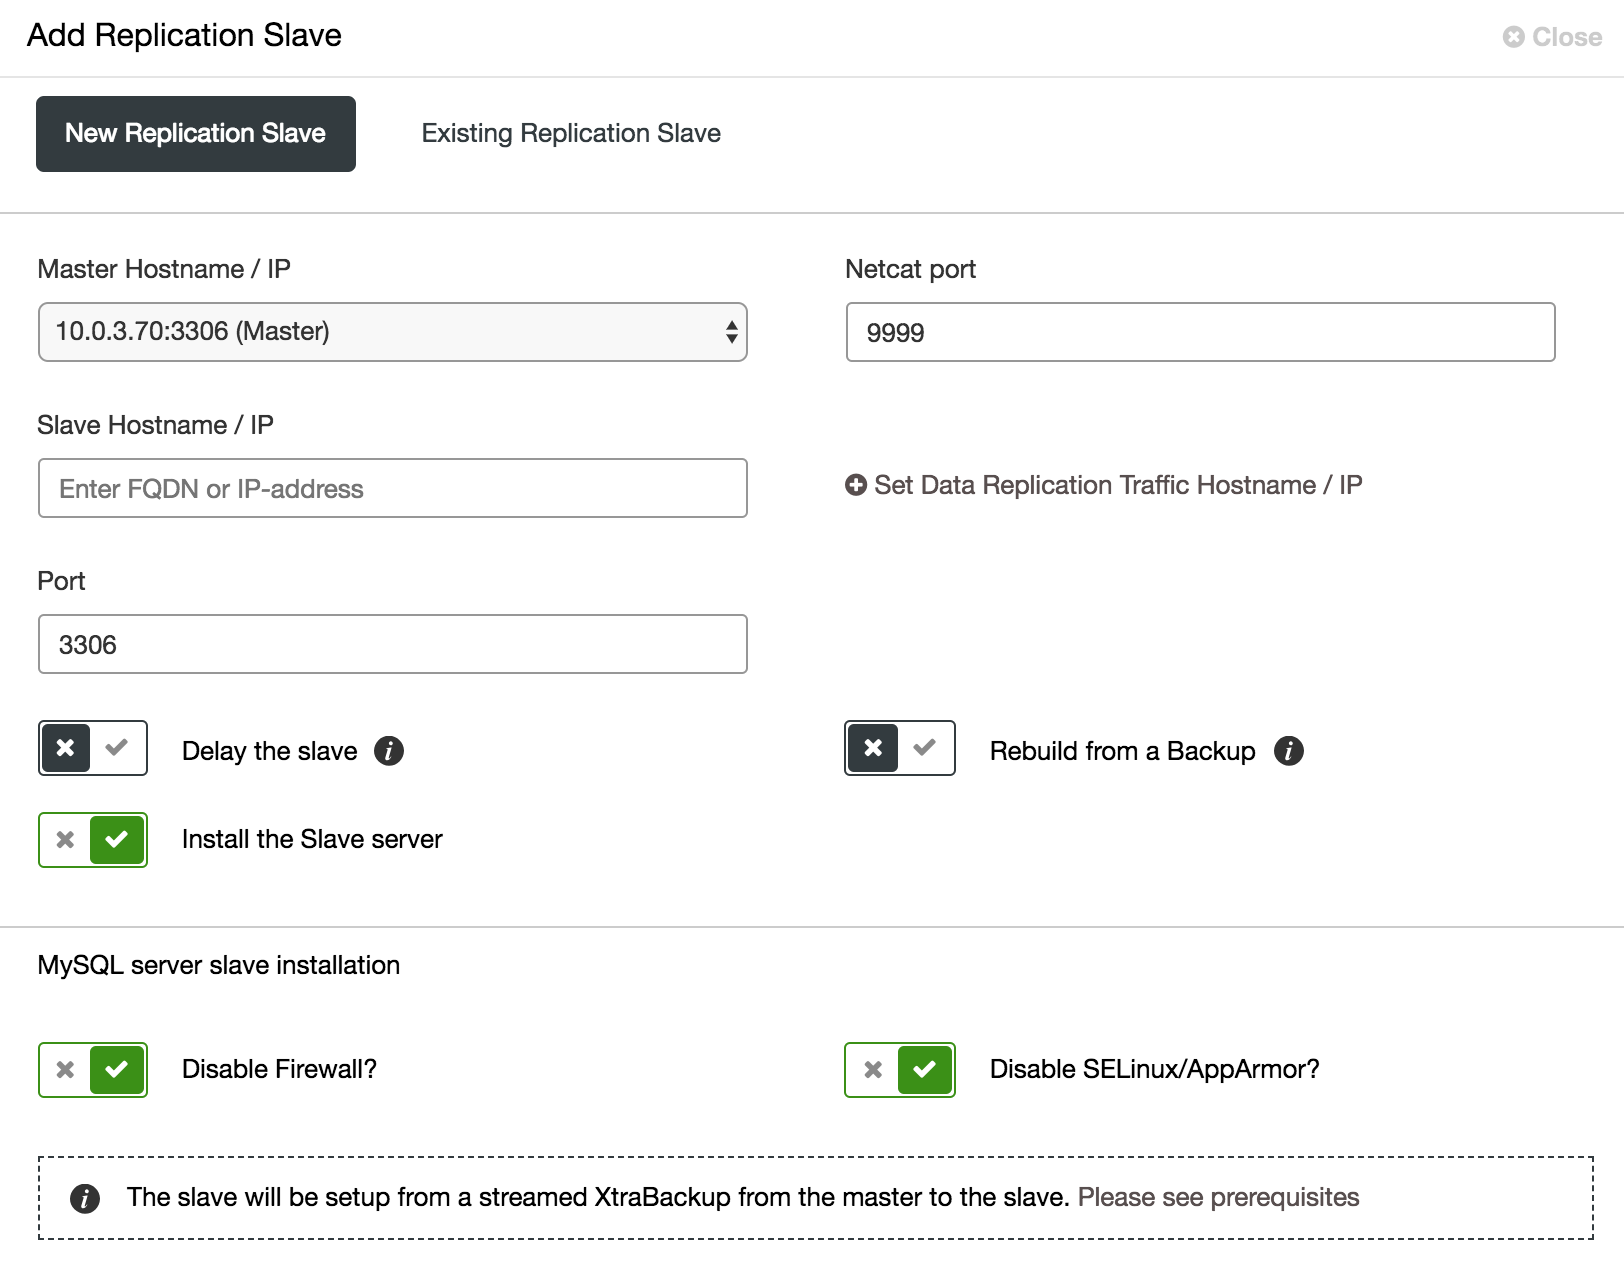
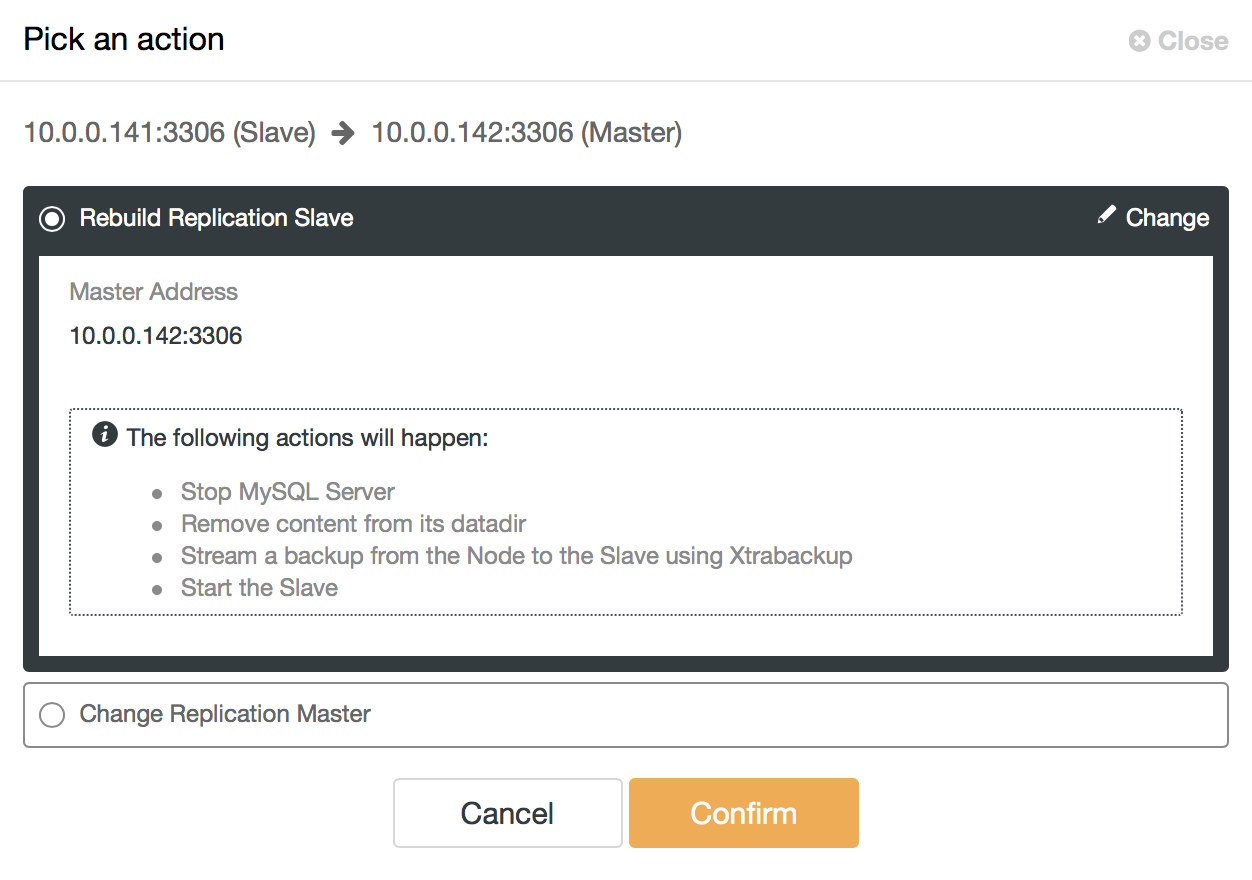
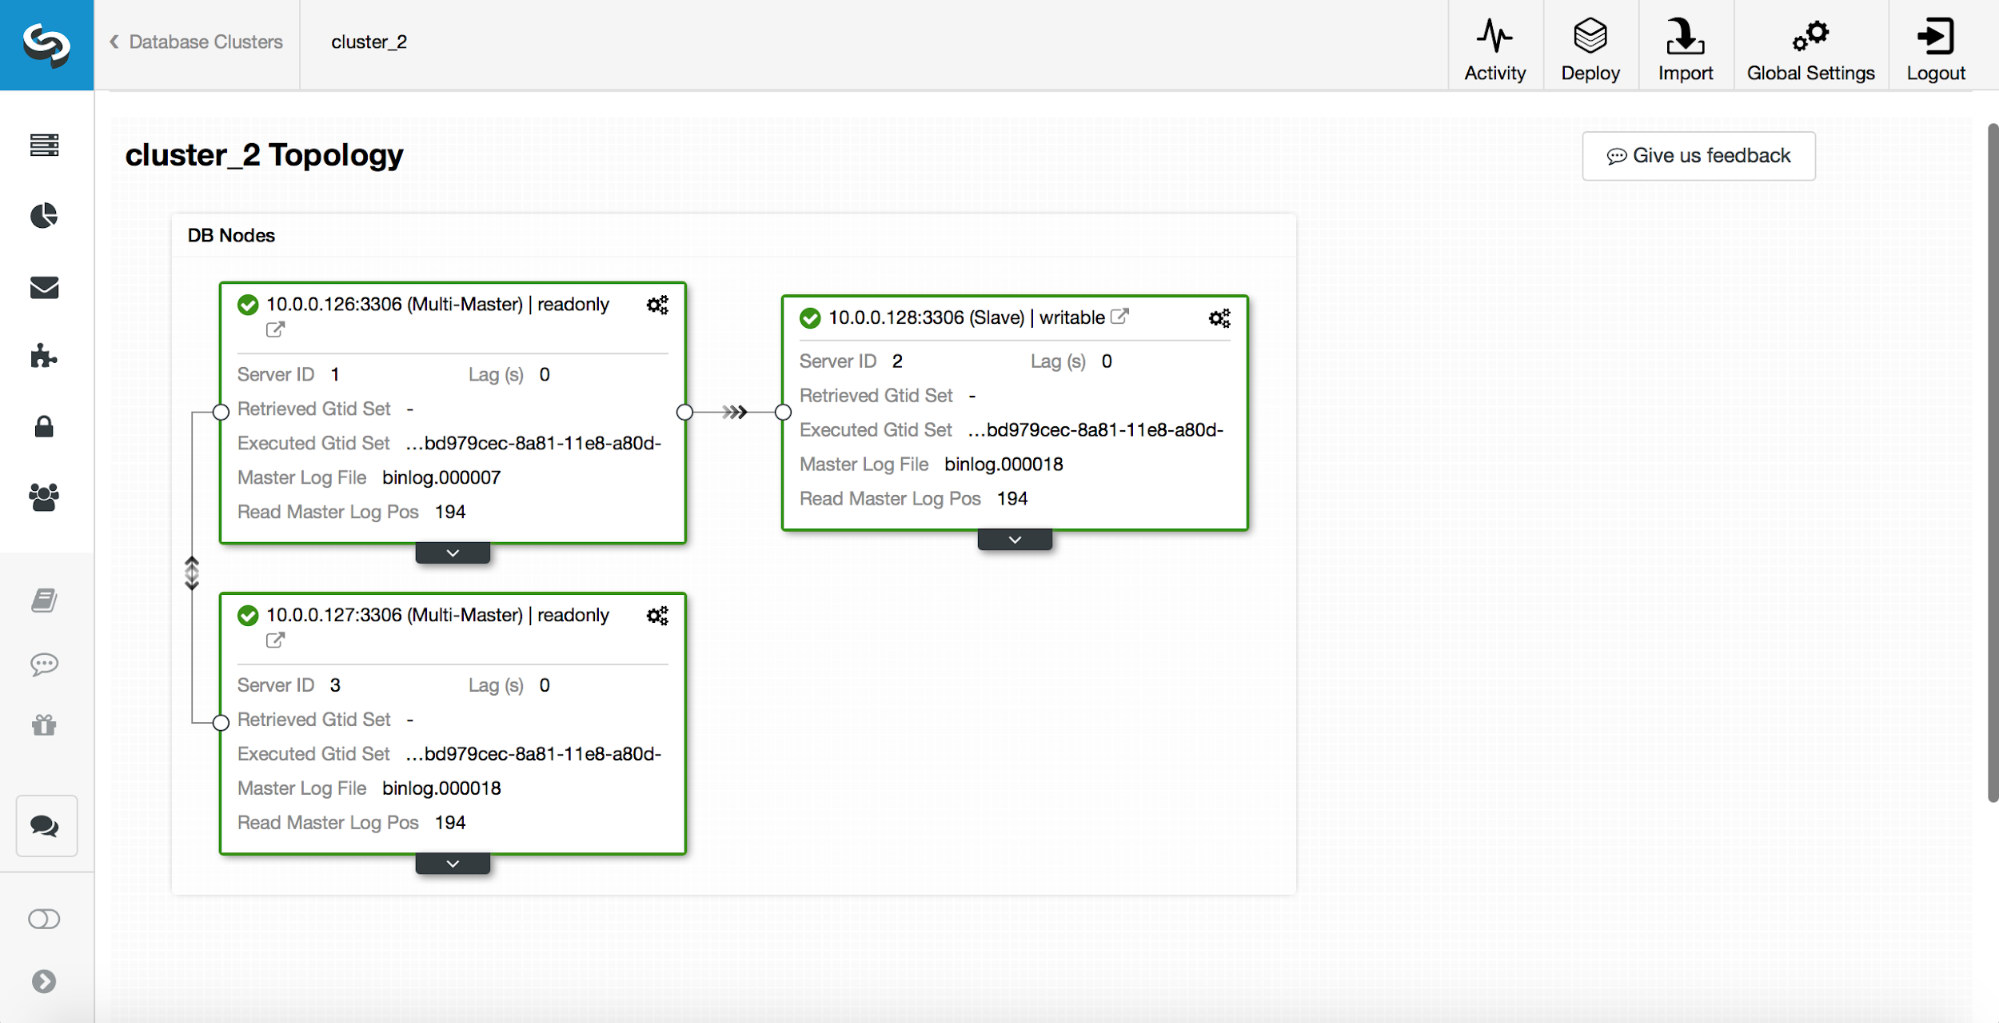
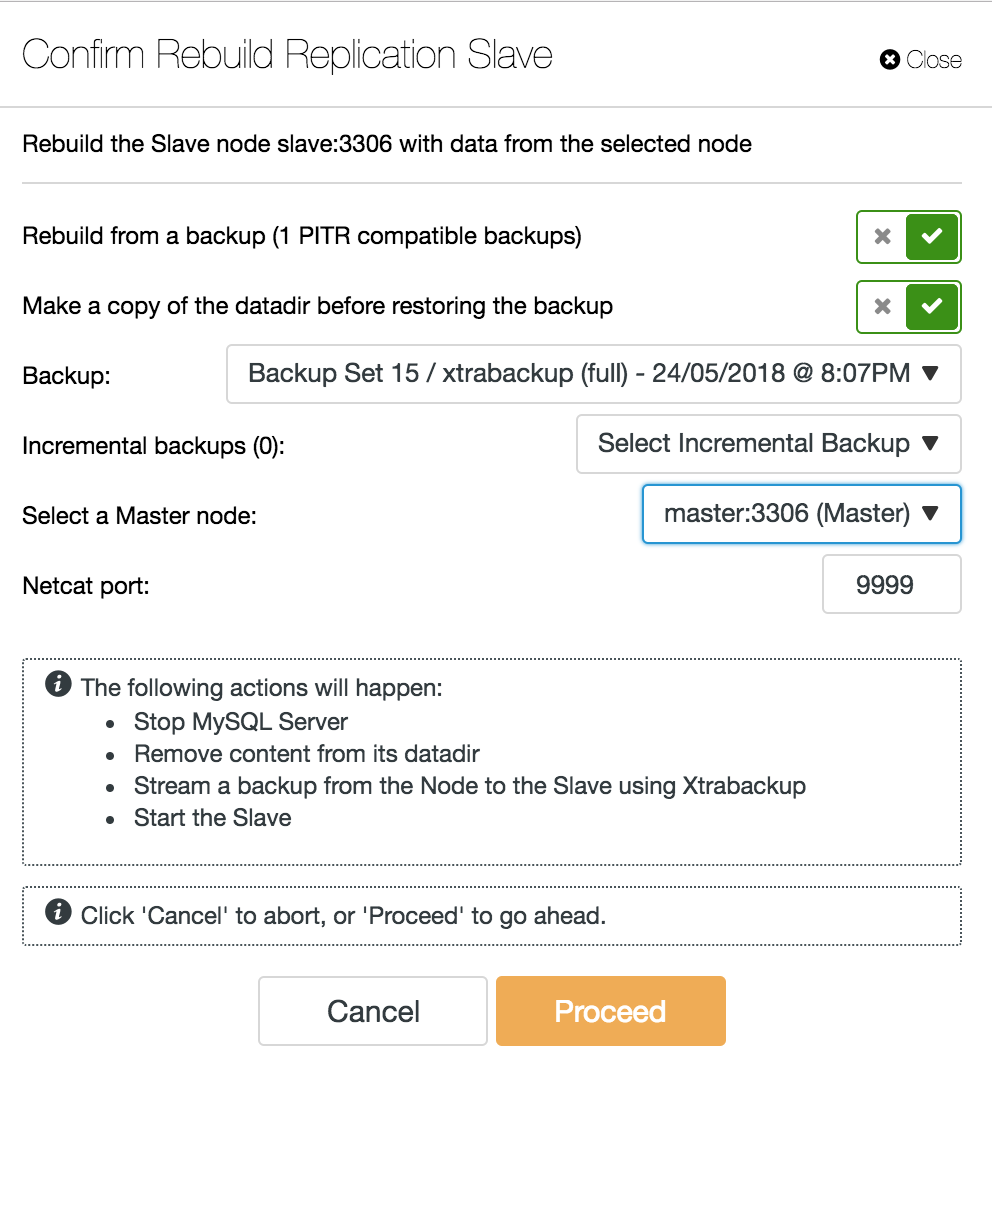
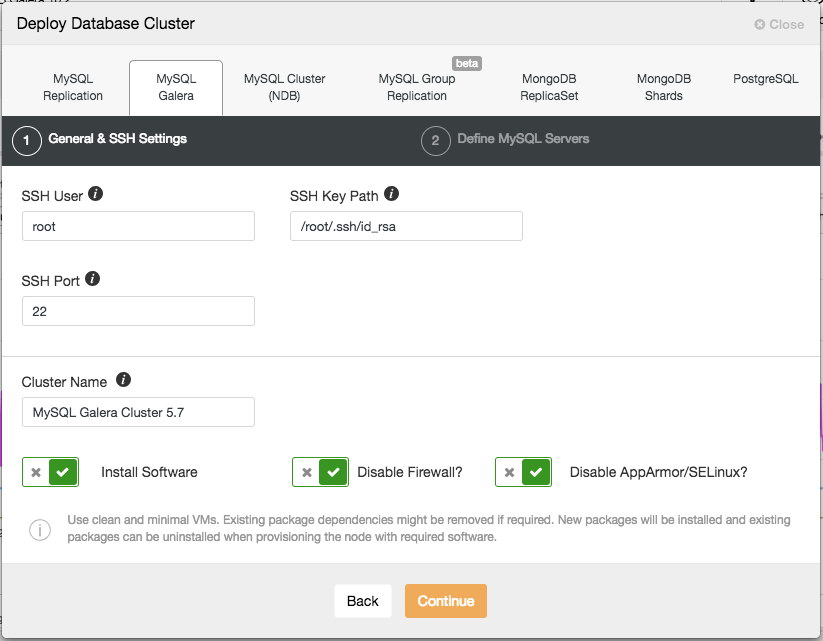
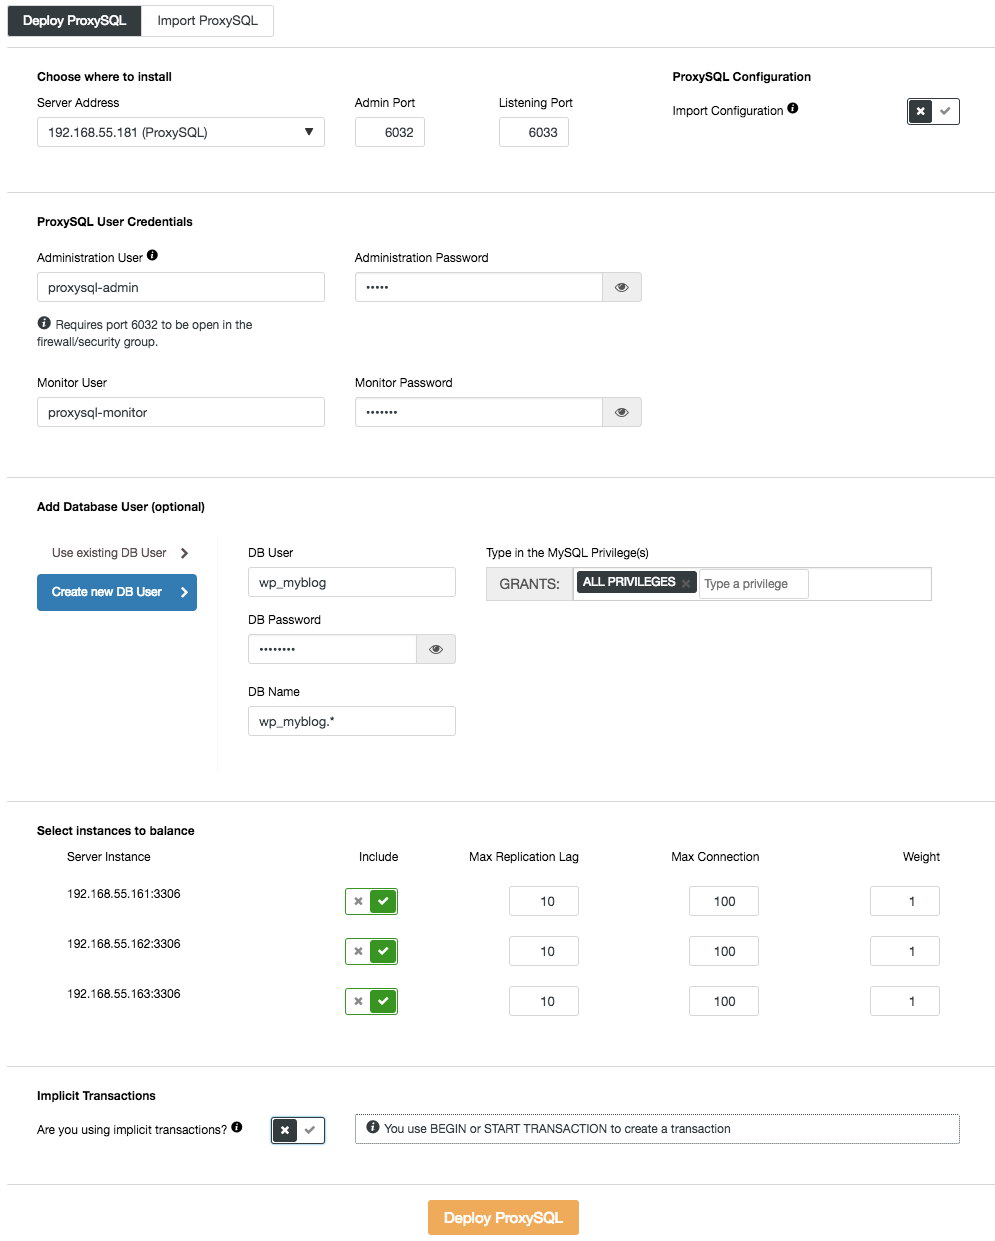
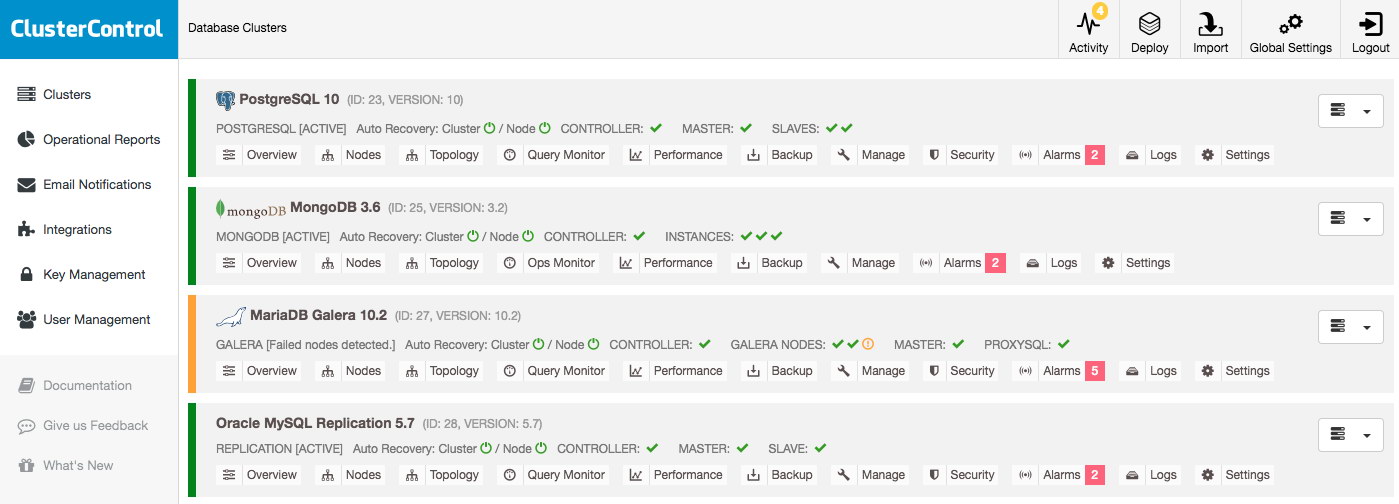
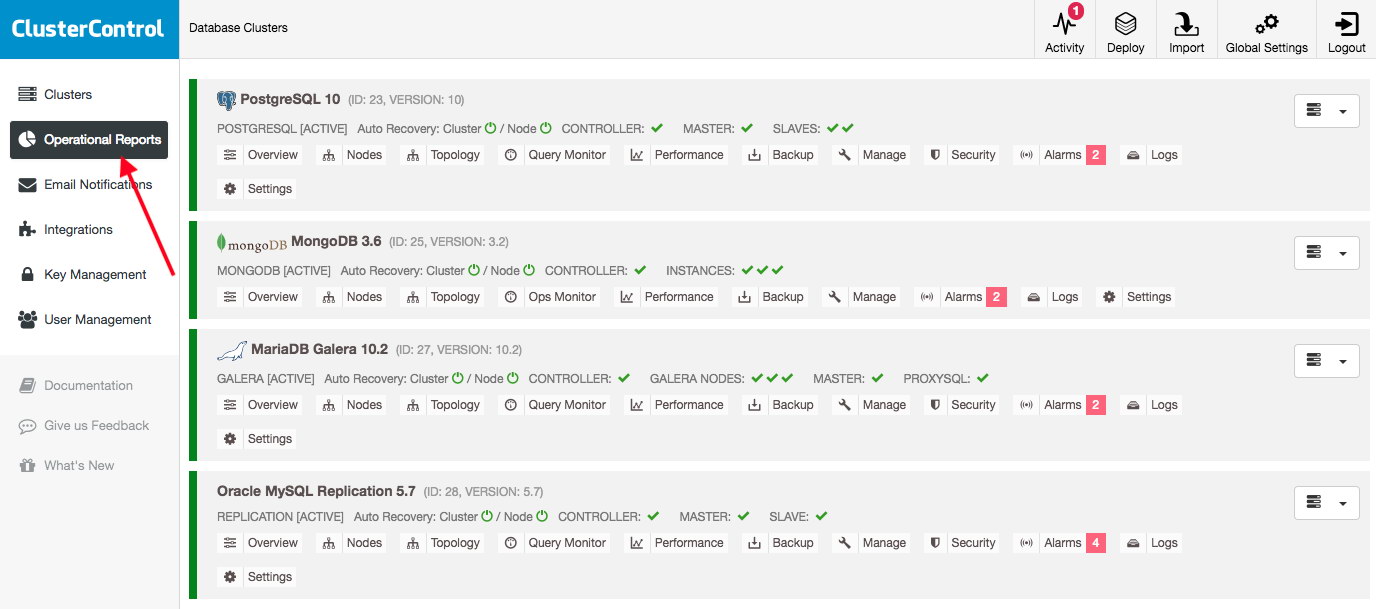
Scaling out an asynchronous slave is one-click away if you are using ClusterControl -> Add Replication Slave feature:

Take note that binary logs must be enabled on the master (the chosen Galera node) before we can proceed with this setup. We have also covered the manual way in this previous post.

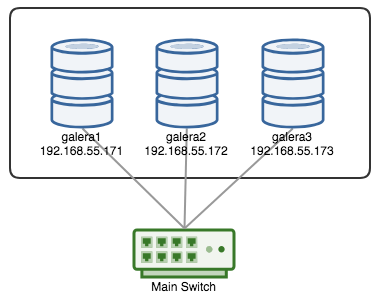
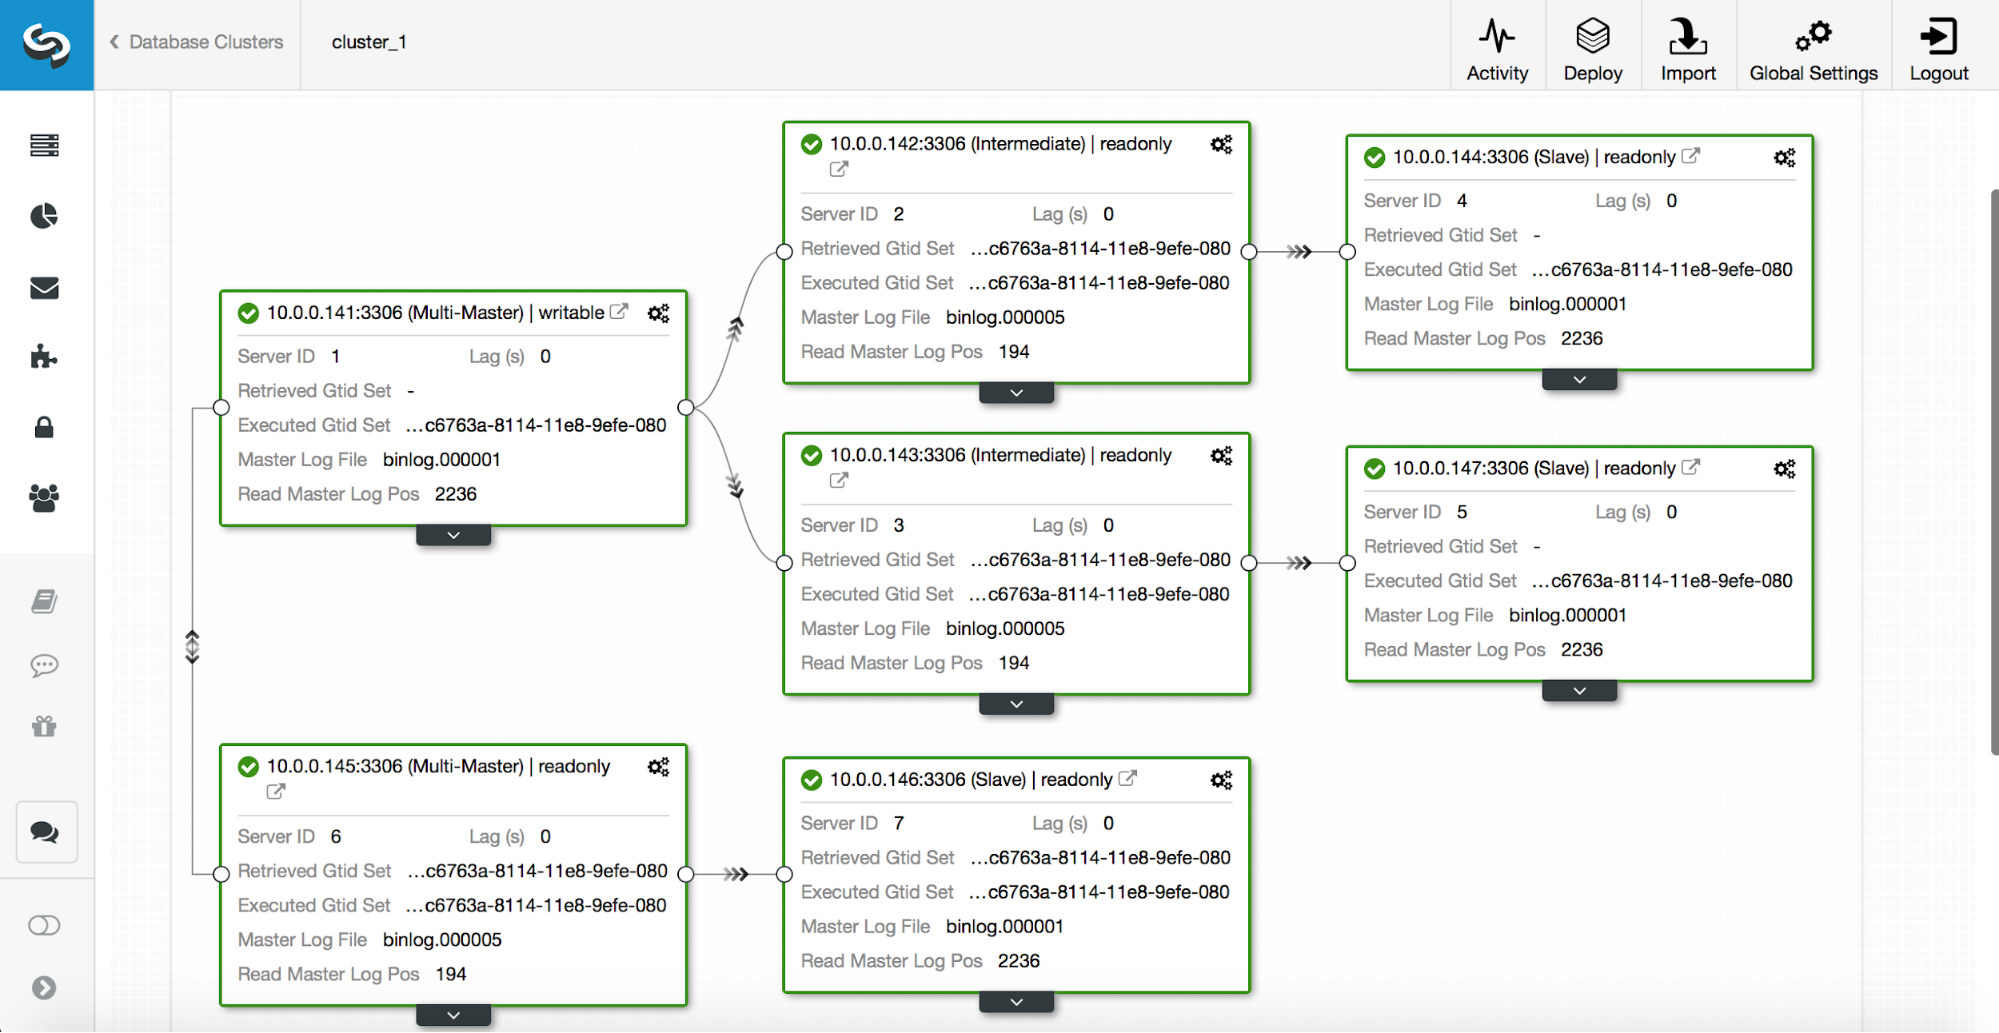
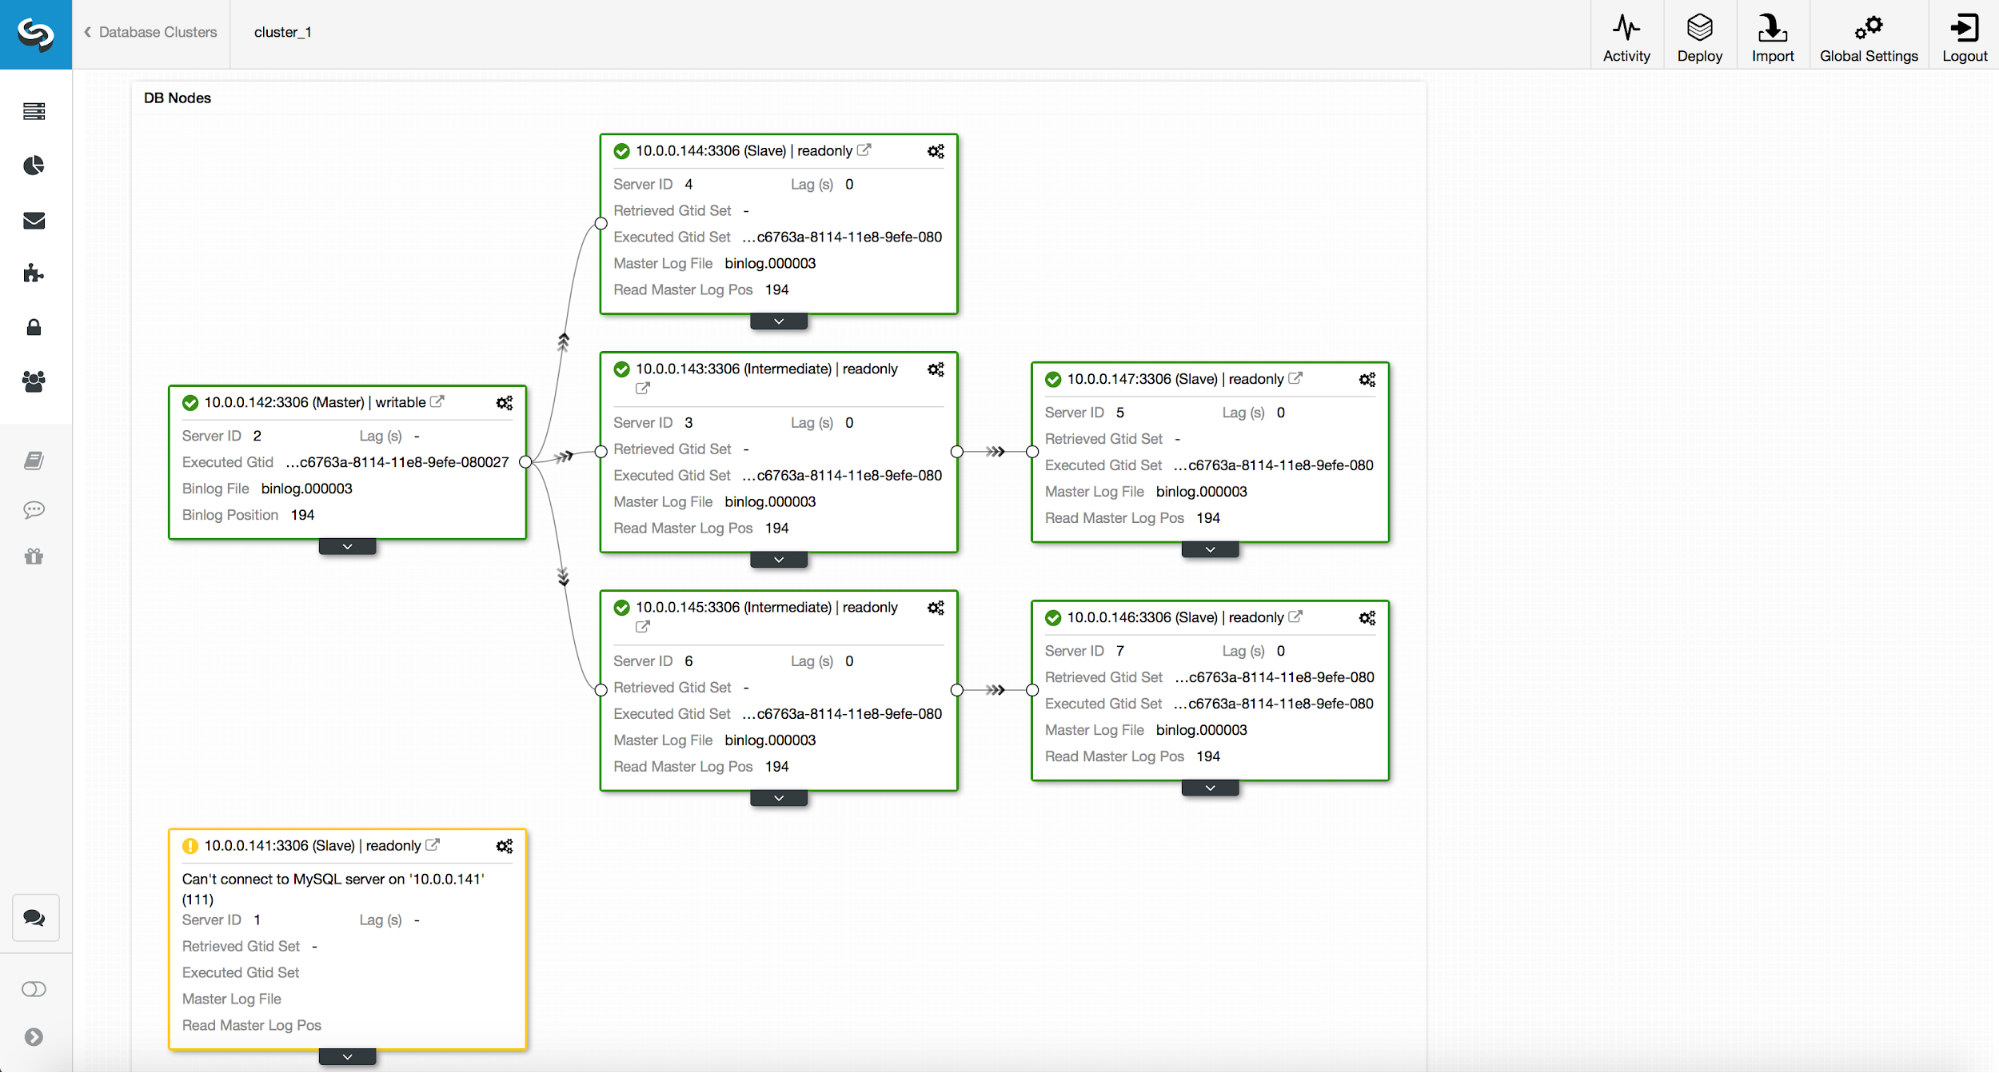
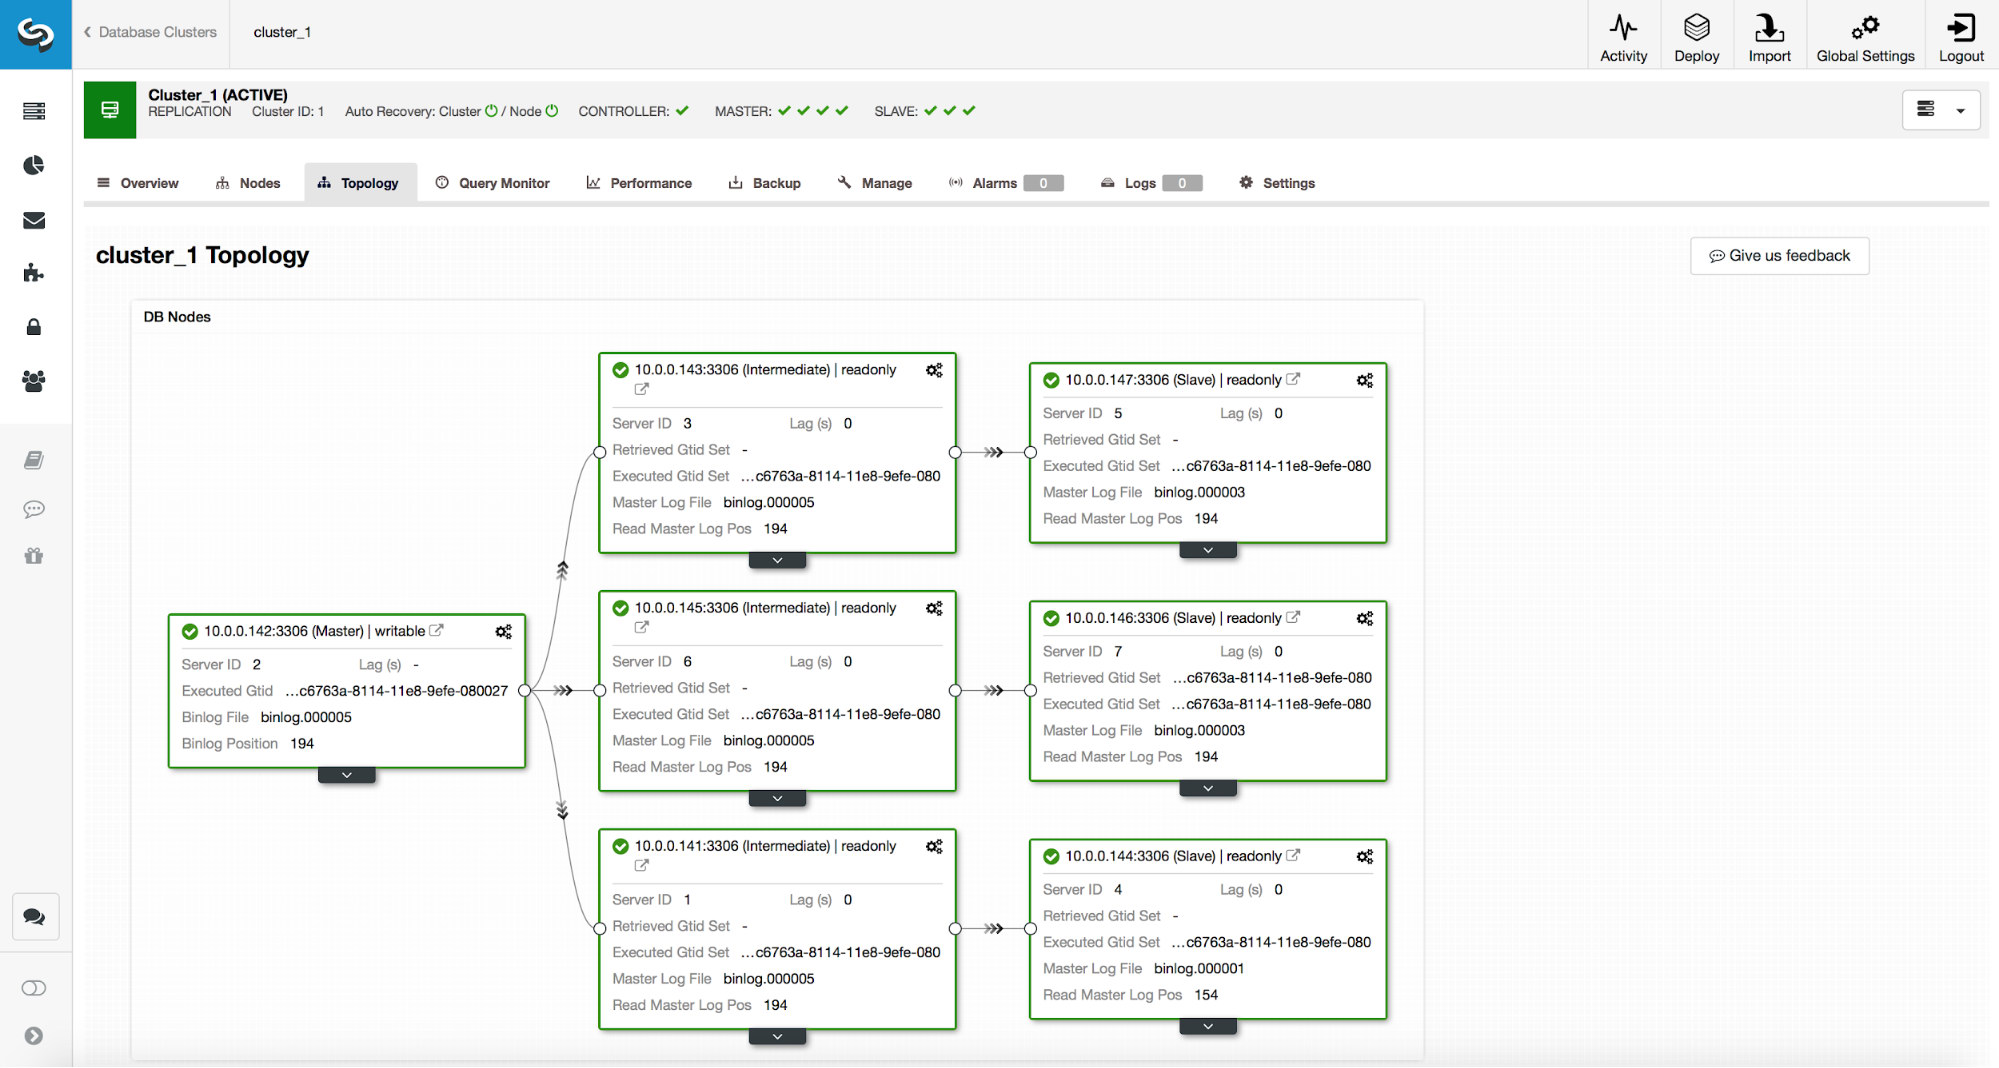
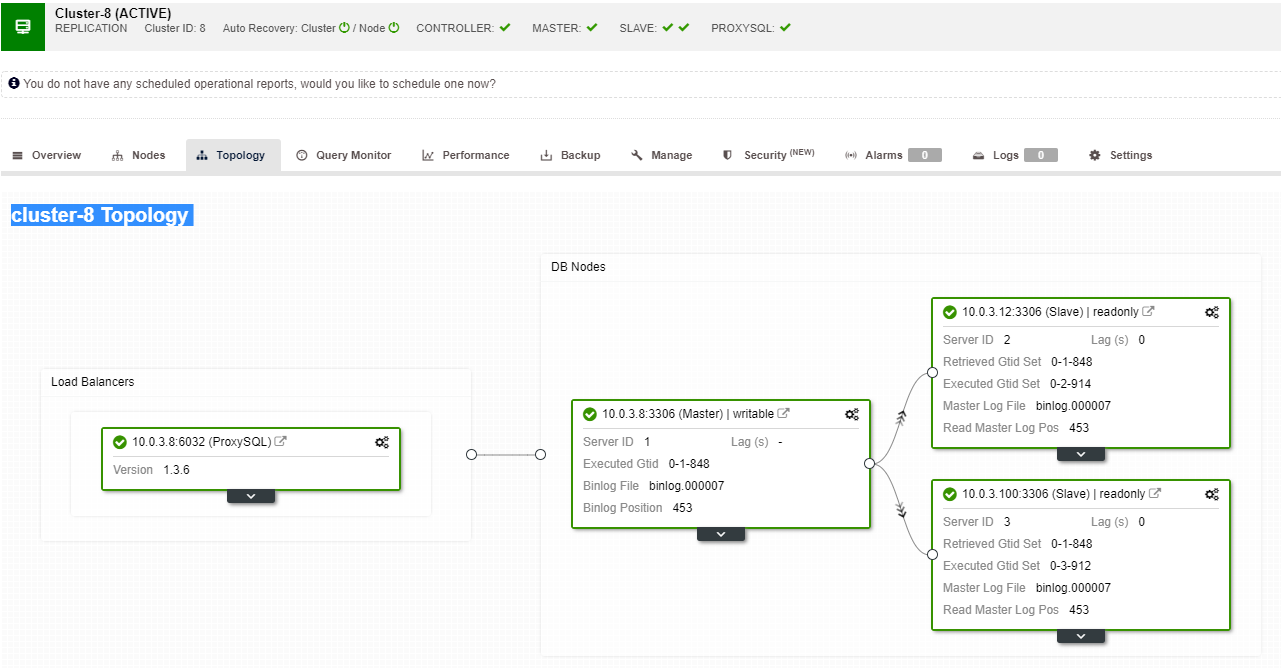
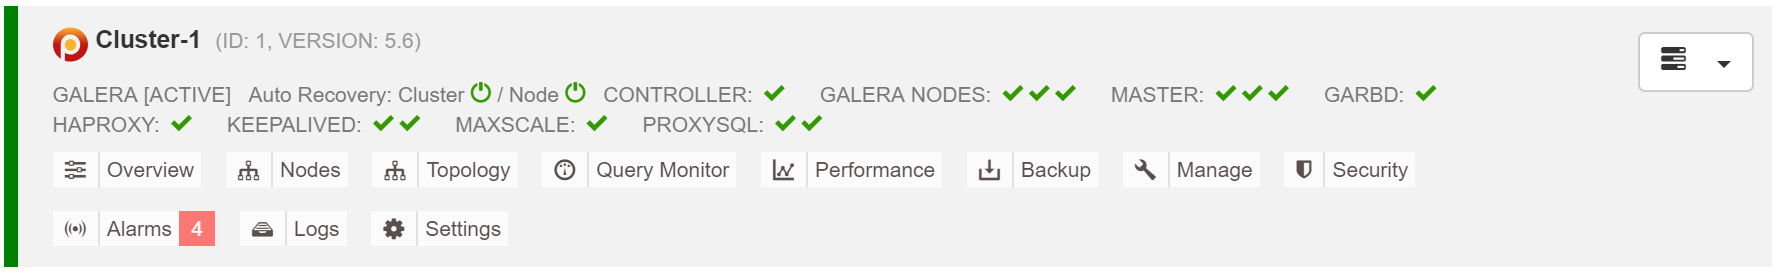
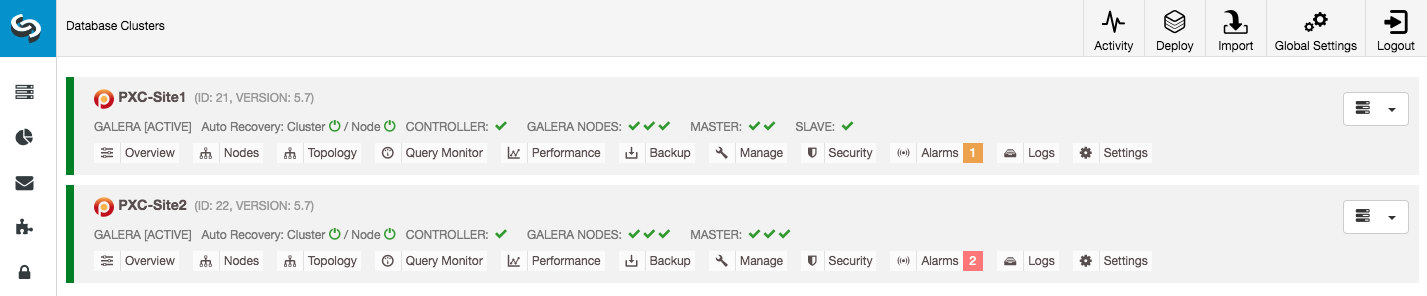
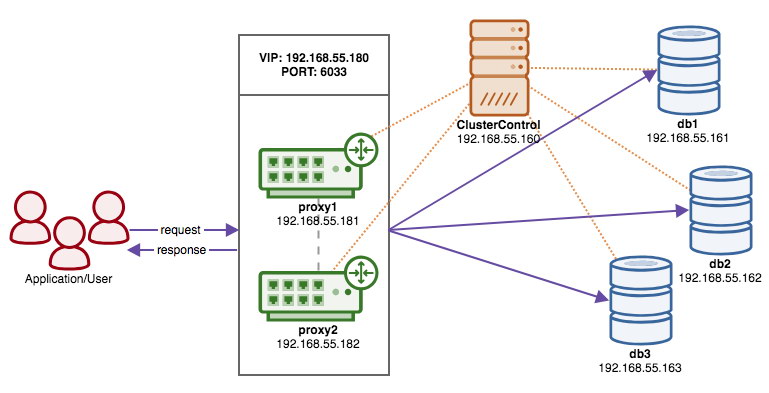
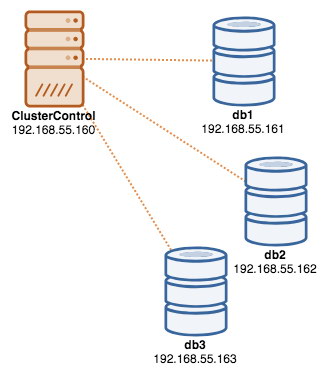
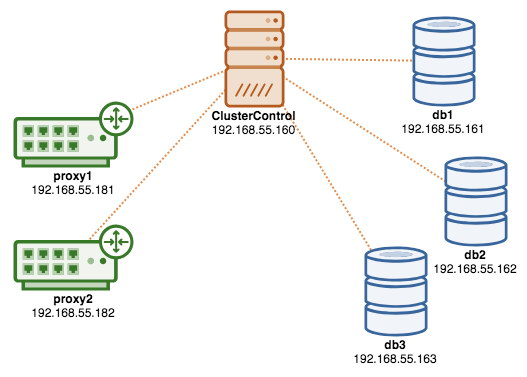
The following screenshot from ClusterControl shows the cluster topology, it illustrates our Galera Cluster architecture with an asynchronous slave:

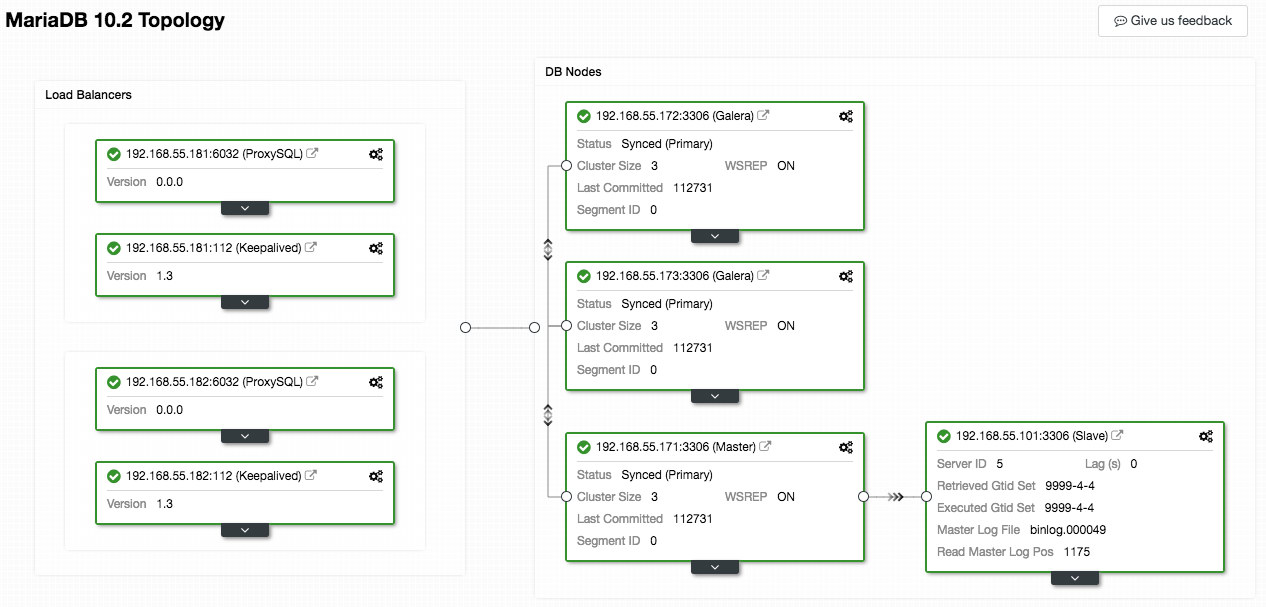
ClusterControl automatically discovers the topology and generates the super cool diagram like above. You can also perform administration tasks directly from this page by clicking on the top-right gear icon of each box.

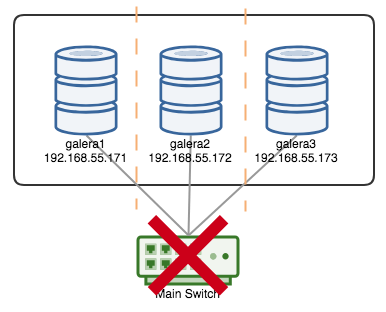
SQL-aware Reverse Proxy

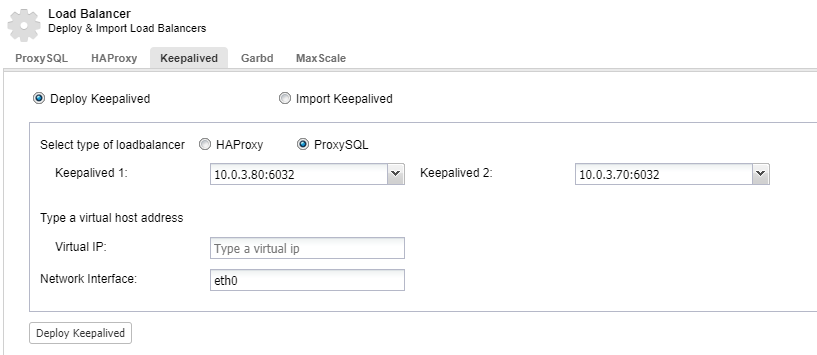
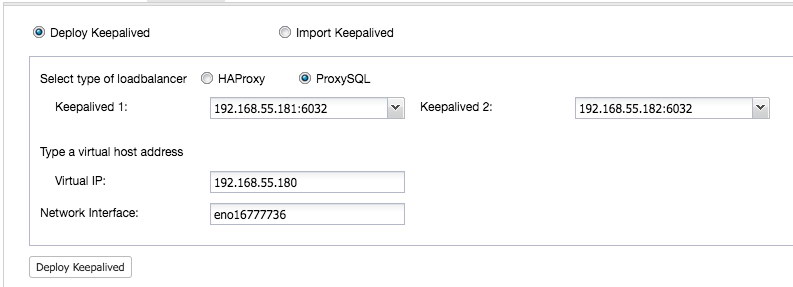
ProxySQL and MariaDB MaxScale are intelligent reverse-proxies which understand MySQL protocol and is capable of acting as a gateway, router, load balancer and firewall in front of your Galera nodes. With the help of Virtual IP Address provider like LVS or Keepalived, and combining this with Galera multi-master replication technology, we can have a highly available database service, eliminating all possible single-point-of-failures (SPOF) from the application point-of-view. This will surely improve the availability and reliability the architecture as whole.

Another advantage with this approach is you will have the ability to monitor, rewrite or re-route the incoming SQL queries based on a set of rules before they hit the actual database server, minimizing the changes on the application or client side and routing queries to a more suitable node for optimal performance. Risky queries for Galera like LOCK TABLES and FLUSH TABLES WITH READ LOCK can be prevented way ahead before they would cause havoc to the system, while impacting queries like "hotspot" queries (a row that different queries want to access at the same time) can be rewritten or being redirected to a single Galera node to reduce the risk of transaction conflicts. For heavy read-only queries like OLAP or backup, you can route them over to an asynchronous slave if you have any.

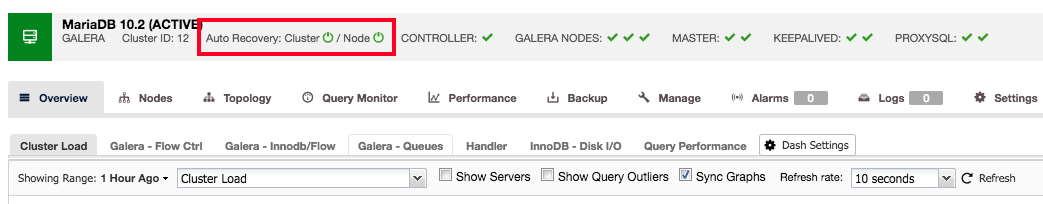
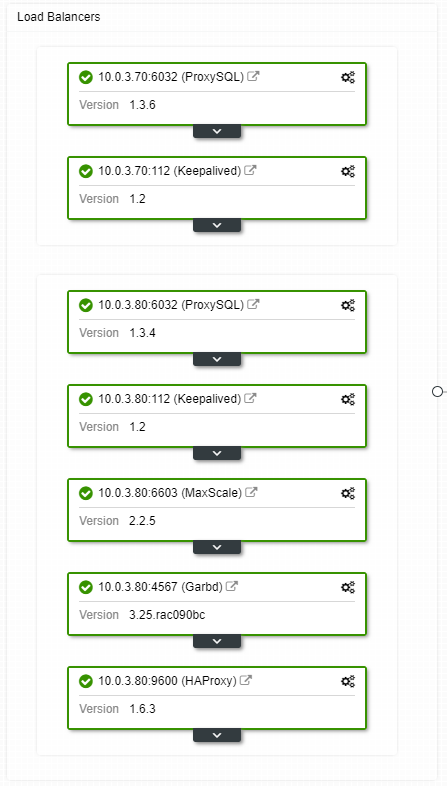
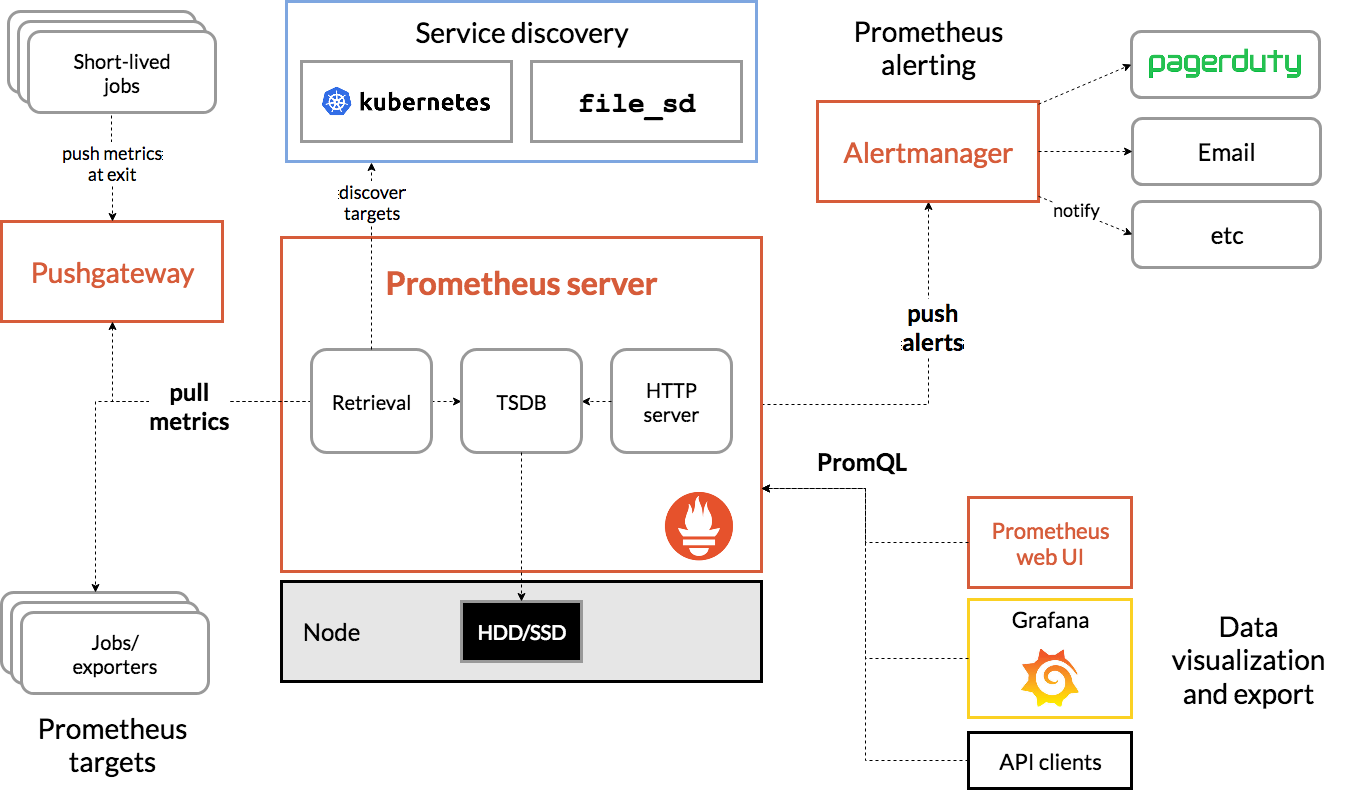
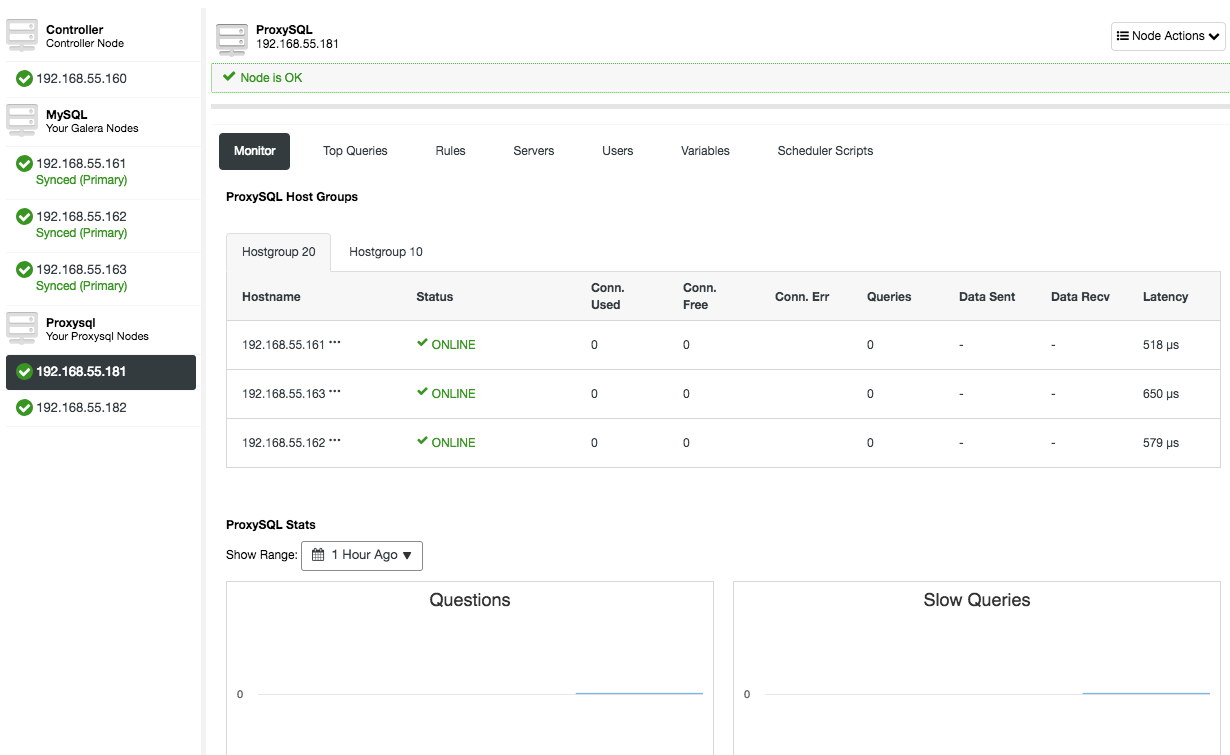
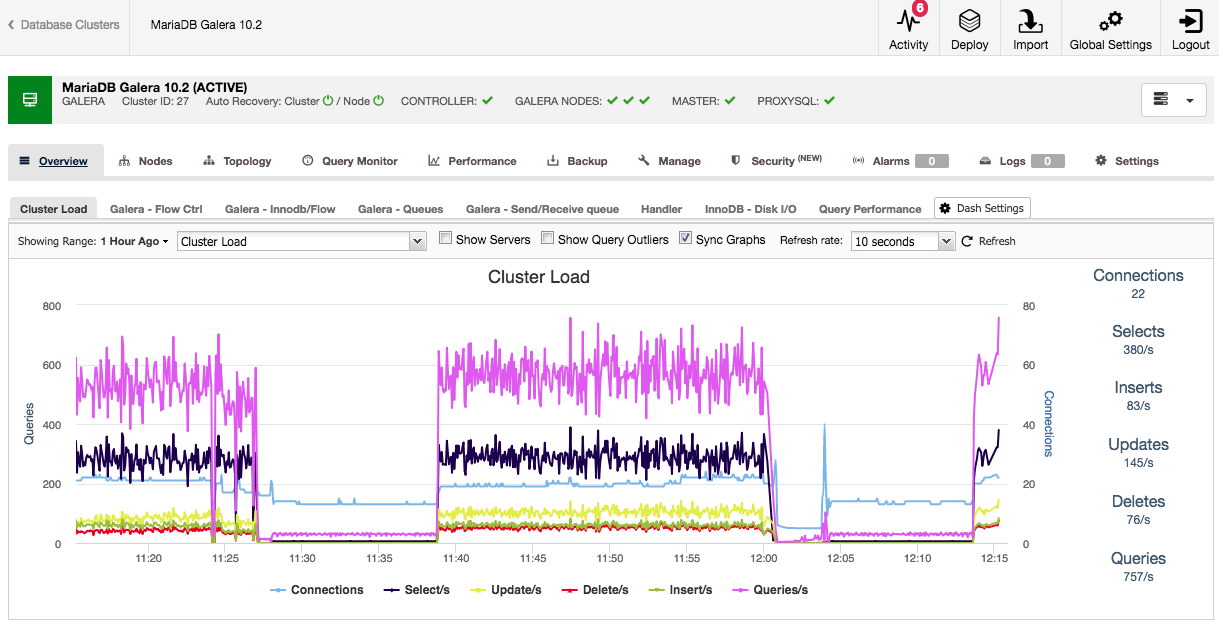
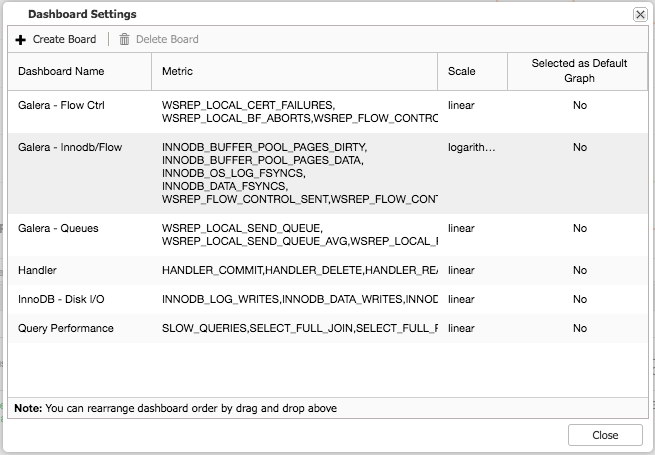
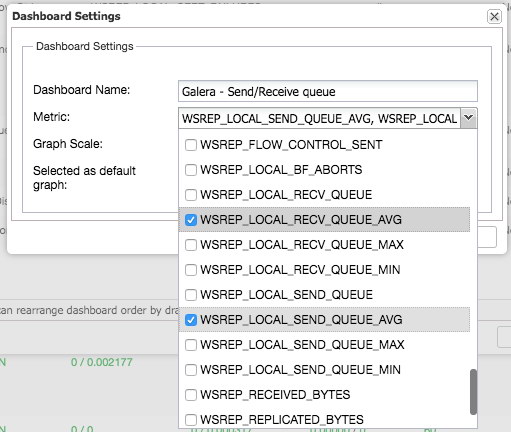
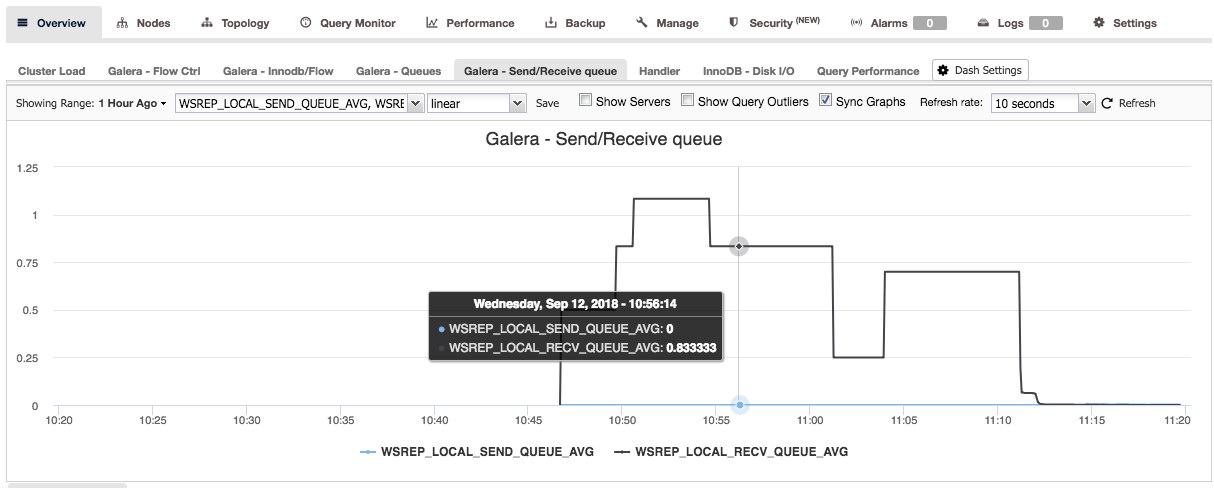
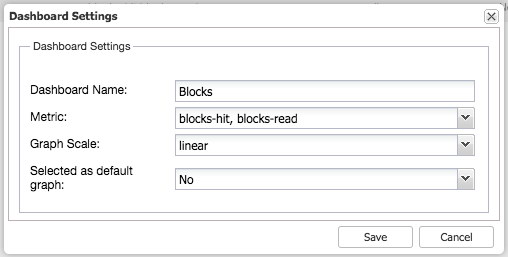
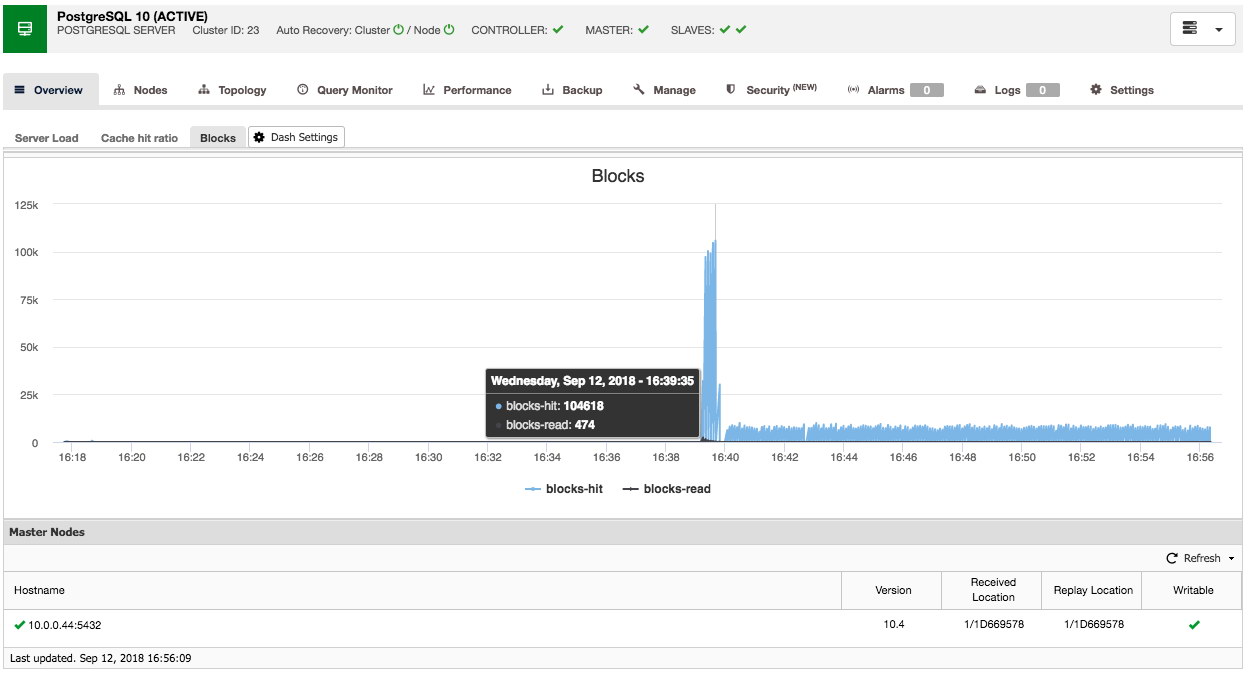
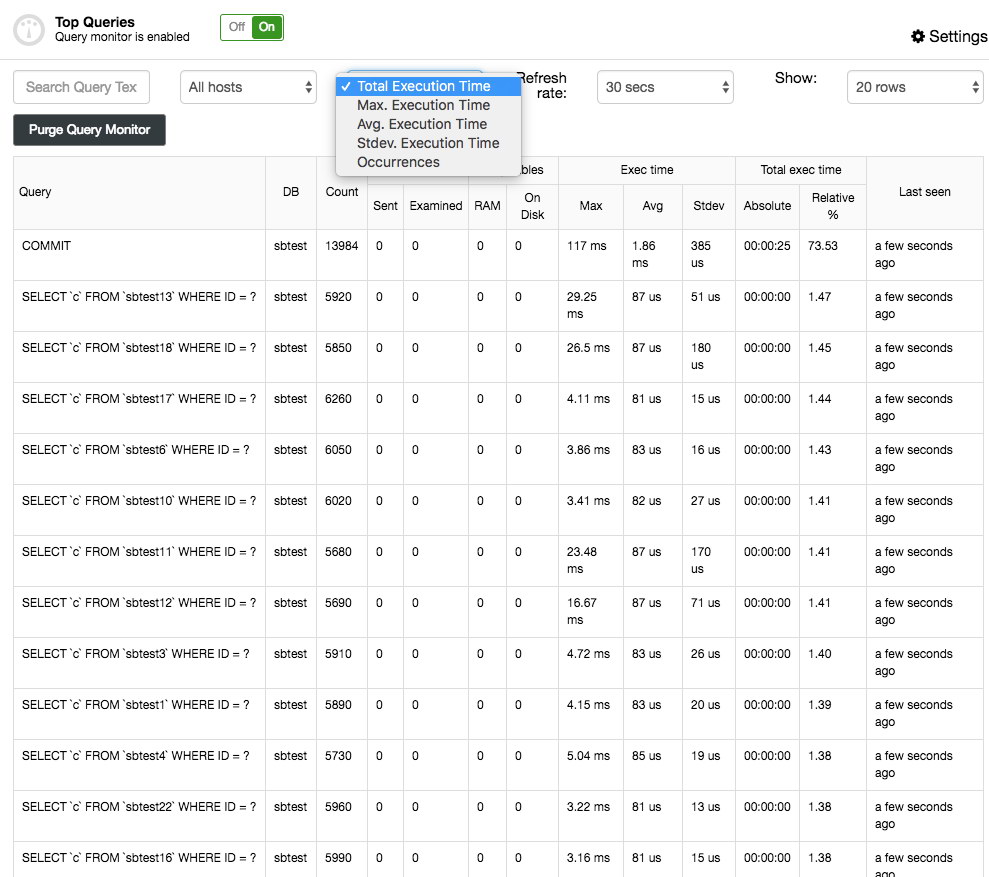
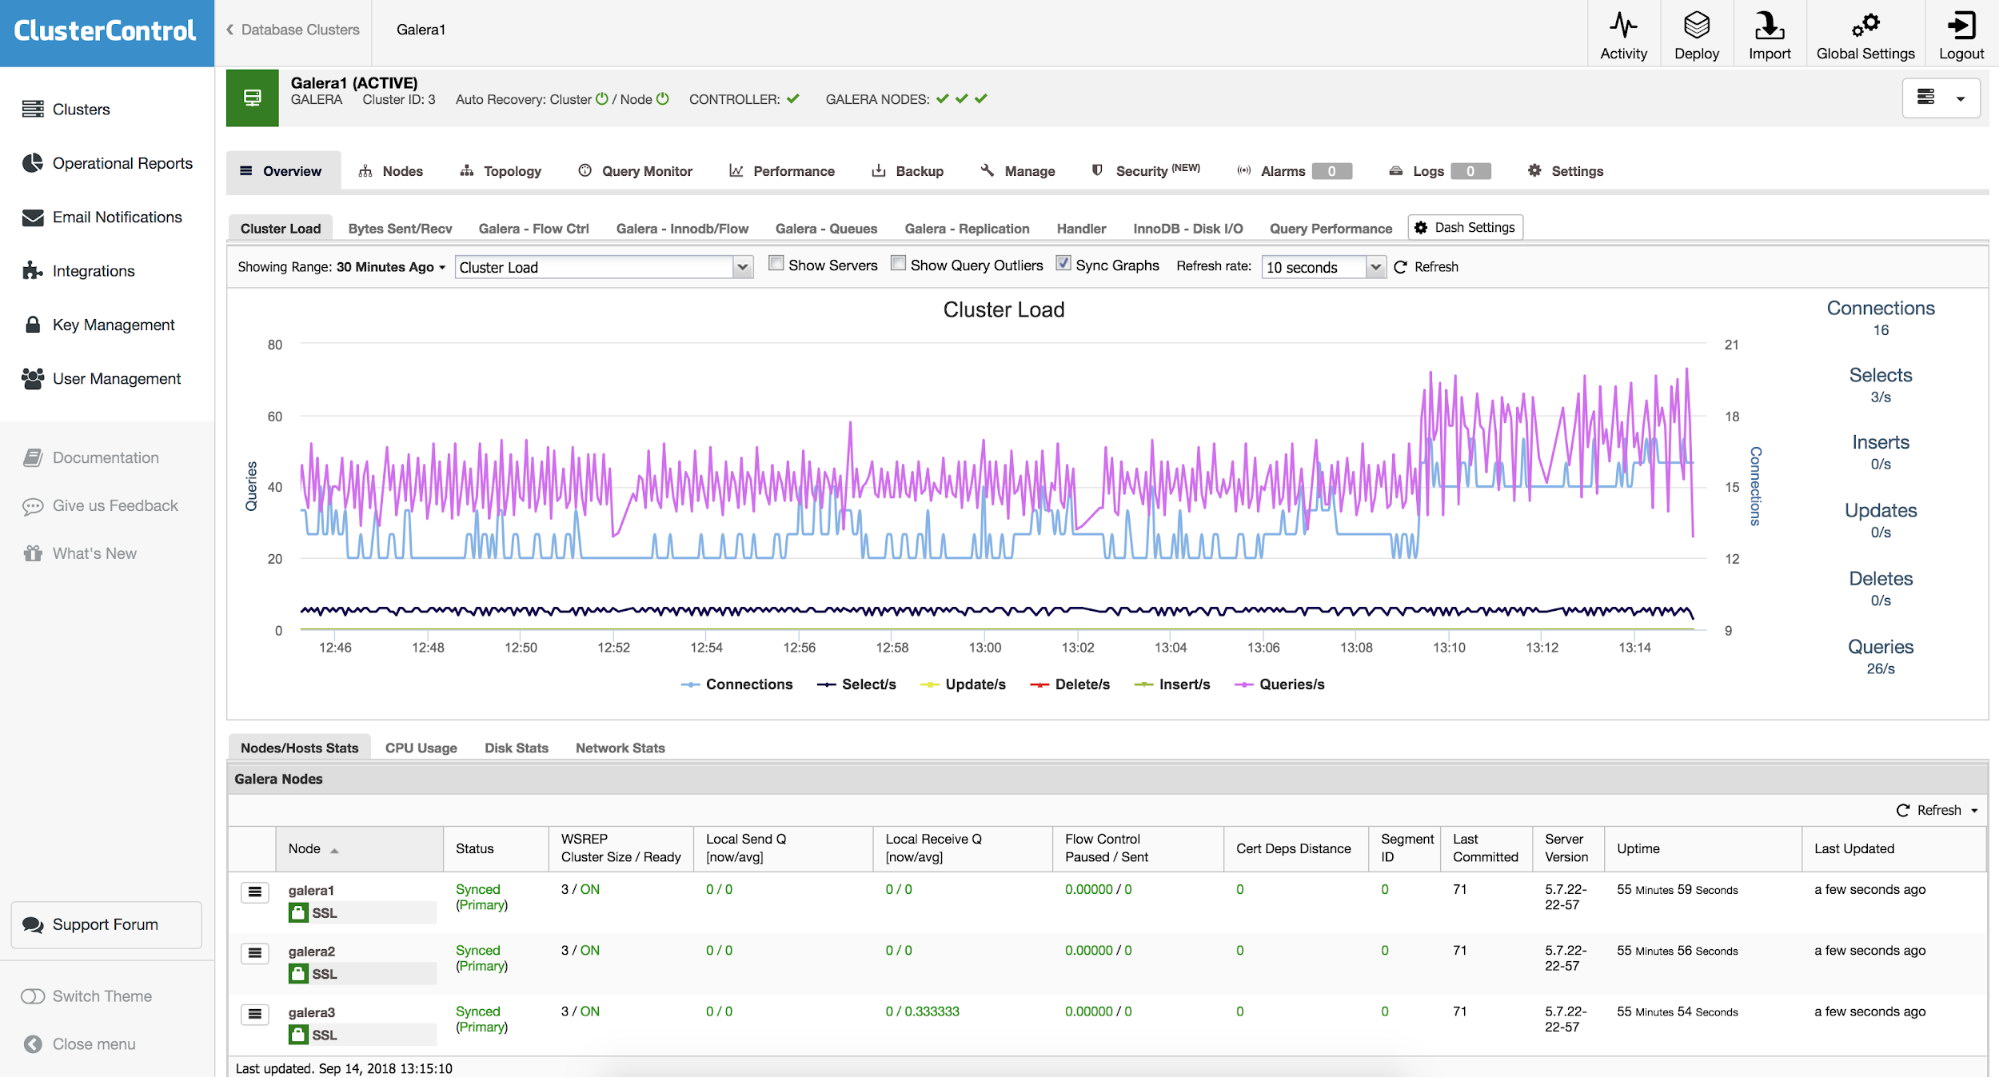
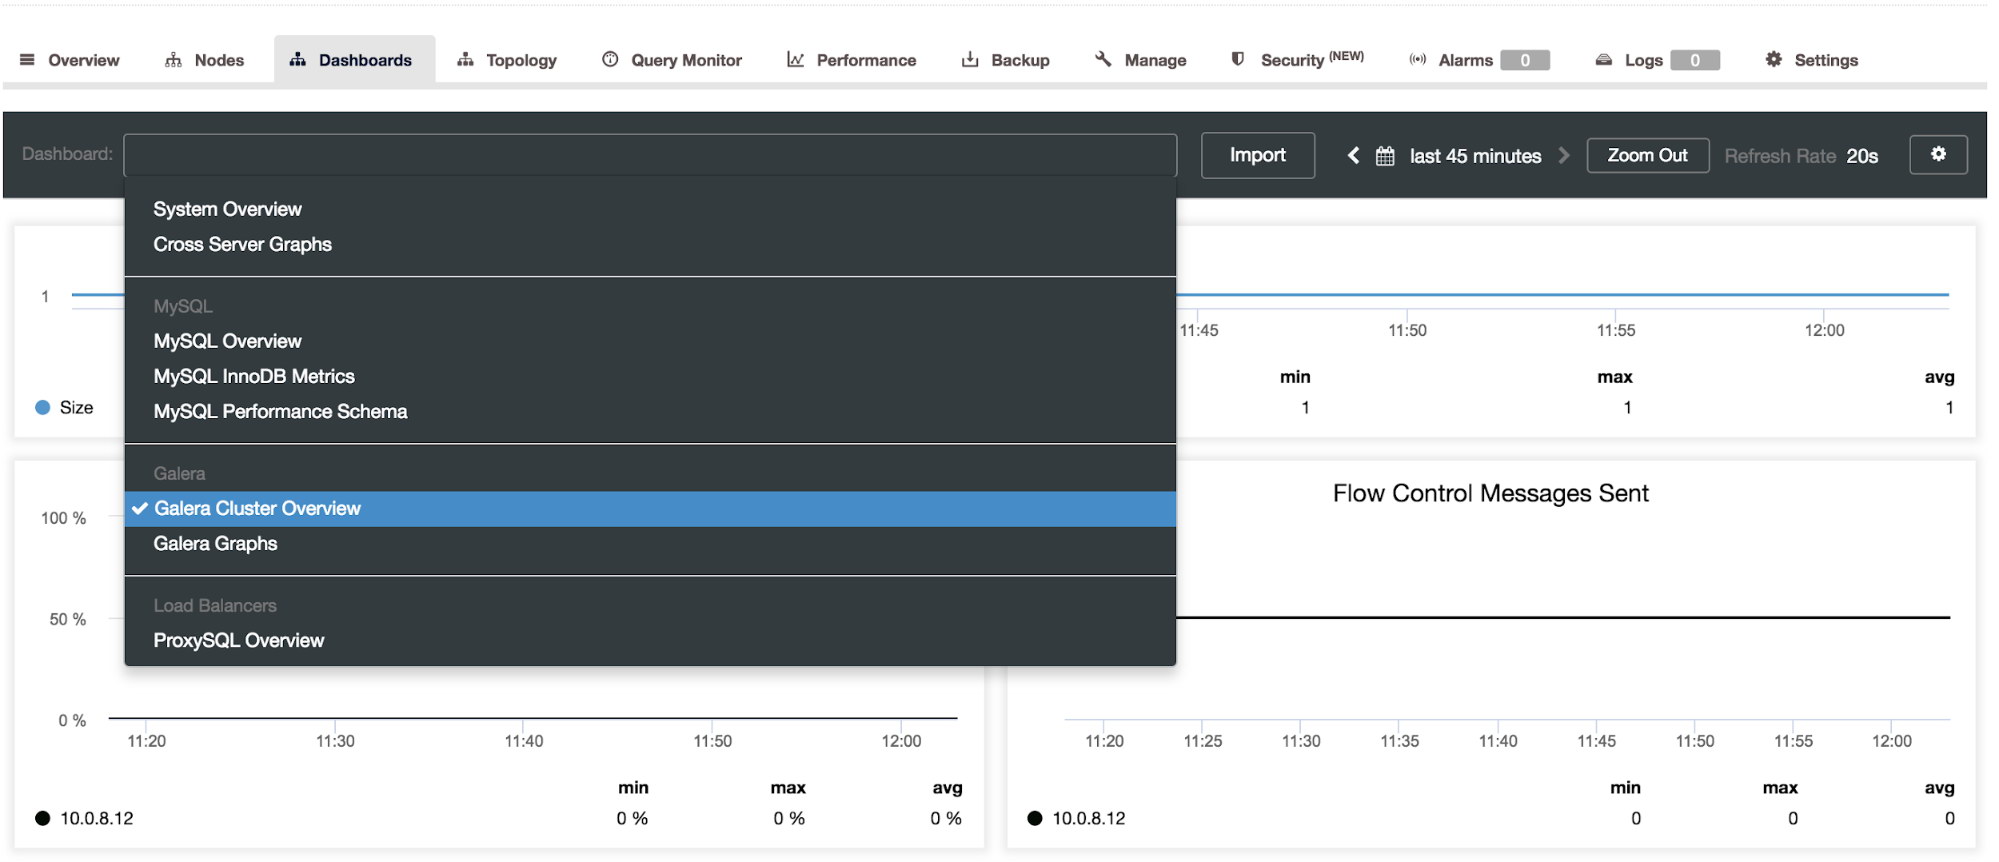
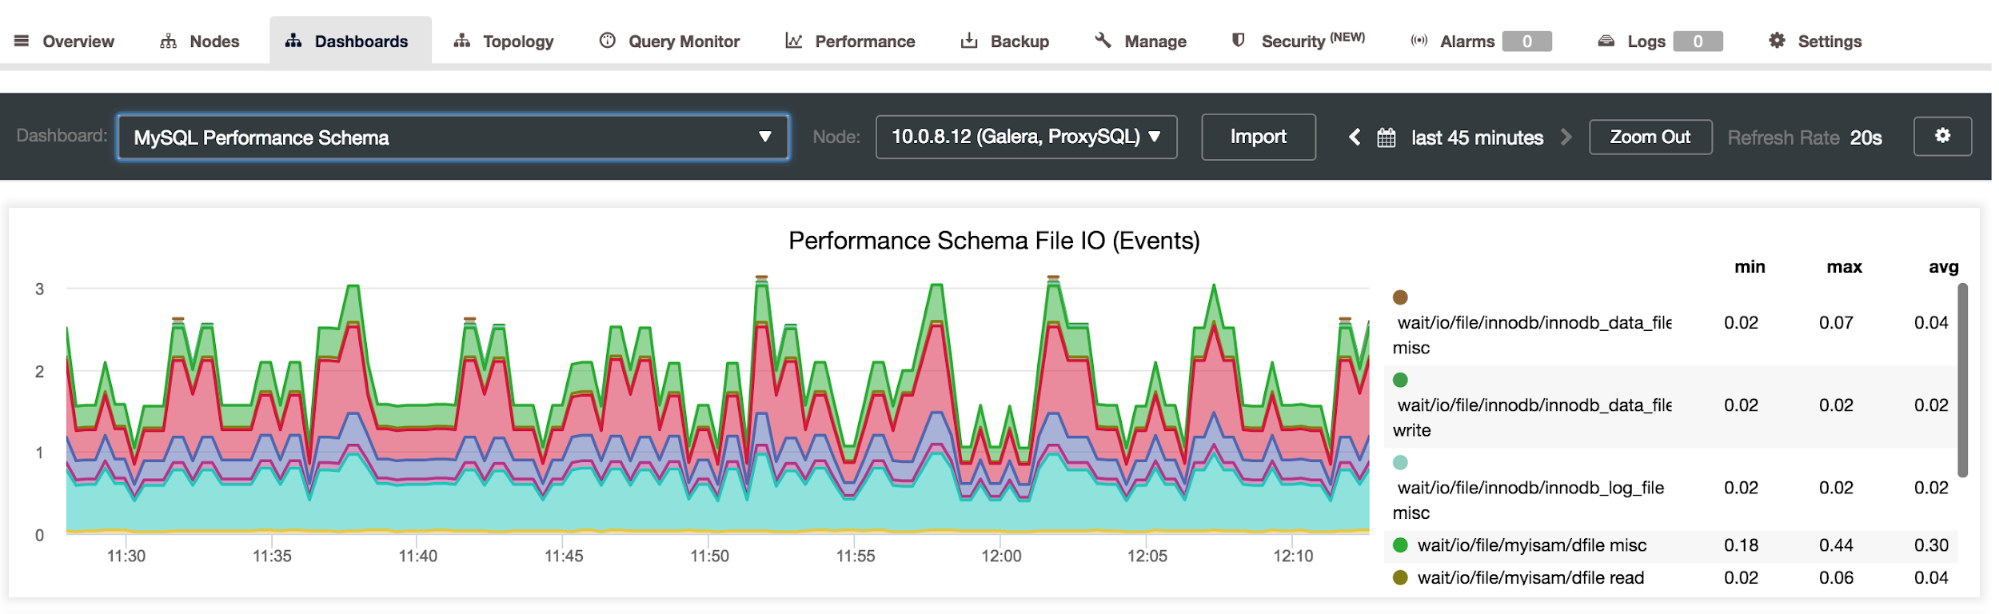
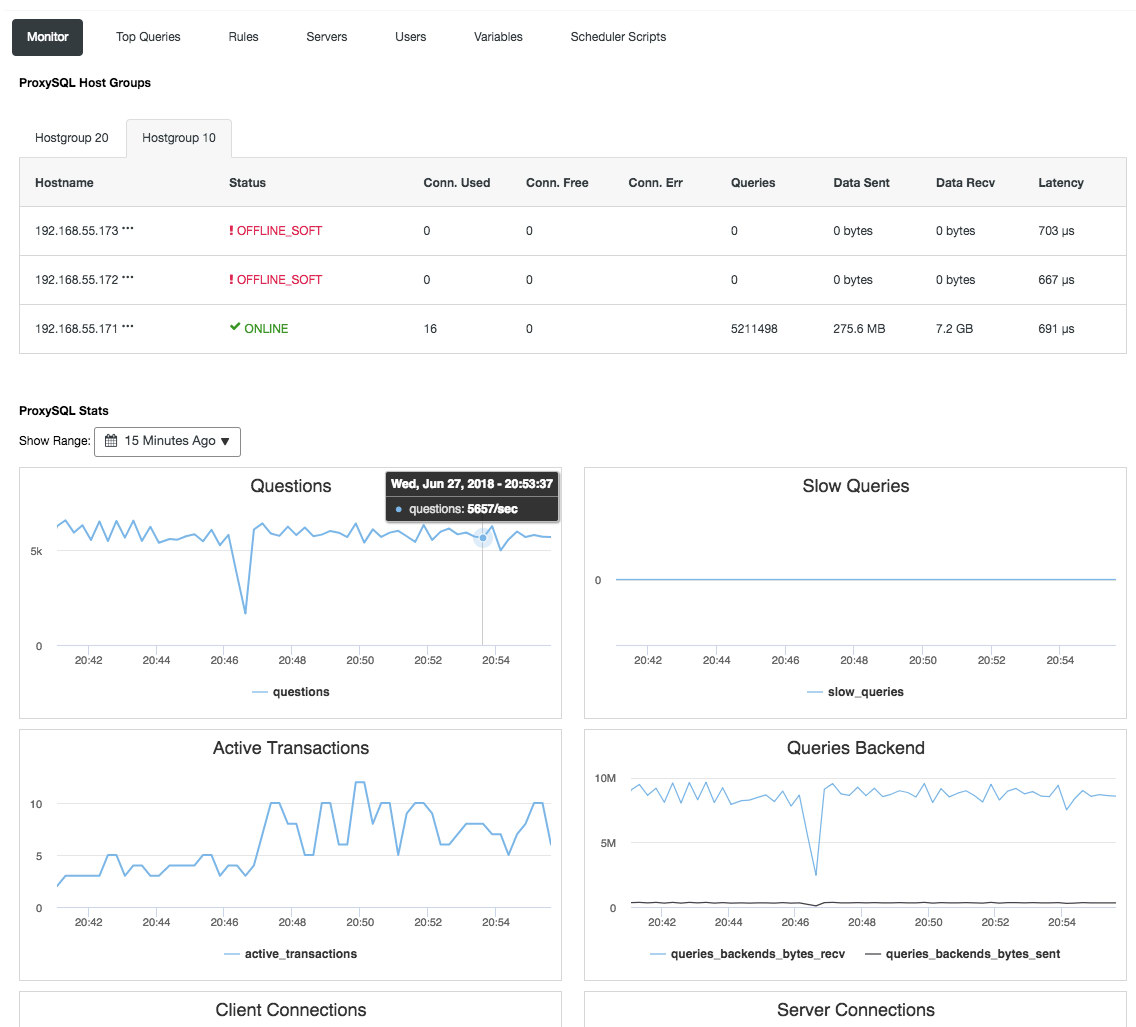
Reverse proxy also monitors the database state, queries and variables to understand the topology changes and produce an accurate routing decision to the backend servers. Indirectly, it centralizes the nodes monitoring and cluster overview without the need to check on each and every single Galera node regularly. The following screenshot shows the ProxySQL monitoring dashboard in ClusterControl:

There are also many other benefits that a load balancer can bring to improve Galera Cluster significantly, as covered in details in this blog post, Become a ClusterControl DBA: Making your DB components HA via Load Balancers.

Final Thoughts

With good understanding on how Galera Cluster internally works, we can work around some of the limitations and improve the database service. Happy clustering!


New Whitepaper: Disaster Recovery Planning for MySQL & MariaDB

$
0
0

We’re happy to announce that our new whitepaper Disaster Recovery Planning for MySQL & MariaDB is now available to download for free!

Database outages are almost inevitable and understanding the timeline of an outage can help us better prepare, diagnose and recover from one. To mitigate the impact of downtime, organizations need an appropriate disaster recovery (DR) plan. However, it makes no business sense to abstract the cost of a DR solution from the design of it, so organizations have to implement the right level of protection at the lowest possible cost.

This white paper provides essential insights into how to build such a plan, discussing the database mechanisms involved as well as how these mechanisms can be fully automated with ClusterControl, a management platform for open source database systems.

Topics included in this whitepaper are…

  • Business Considerations for Disaster Recovery
    • Is 100% Uptime Possible?
    • Analysing Risk
    • Assessing Business Impact
  • Defining Disaster Recovery
    • Recovery Time Objectives
    • Recovery Point Objectives
  • Disaster Recovery Tiers
    • Offsite Data
    • Backups and Hot Sites

Download the whitepaper today!

ClusterControl
Single Console for Your Entire Database Infrastructure
Find out what else is new in ClusterControl

About the Author

Vinay Joosery, CEO & Co-Founder, Severalnines

Vinay Joosery, CEO, Severalnines, is a passionate advocate and builder of concepts and business around distributed database systems. Prior to co-founding Severalnines, Vinay held the post of Vice-President EMEA at Pentaho Corporation - the Open Source BI leader. He has also held senior management roles at MySQL / Sun Microsystems / Oracle, where he headed the Global MySQL Telecoms Unit, and built the business around MySQL's High Availability and Clustering product lines. Prior to that, Vinay served as Director of Sales & Marketing at Ericsson Alzato, an Ericsson-owned venture focused on large scale real-time databases.

About ClusterControl

ClusterControl is the all-inclusive open source database management system for users with mixed environments that removes the need for multiple management tools. ClusterControl provides advanced deployment, management, monitoring, and scaling functionality to get your MySQL, MongoDB, and PostgreSQL databases up-and-running using proven methodologies that you can depend on to work. At the core of ClusterControl is it’s automation functionality that lets you automate many of the database tasks you have to perform regularly like deploying new databases, adding and scaling new nodes, running backups and upgrades, and more.

To learn more about ClusterControl click here.

New Webinar: Disaster Recovery Planning for MySQL & MariaDB with ClusterControl

$
0
0

Everyone should have a disaster recovery plan for MySQL & MariaDB!

Join Vinay Joosery, CEO at Severalnines, on July 24th for our new webinar on Disaster Recovery Planning for MySQL & MariaDB with ClusterControl; especially if you find yourself wondering about disaster recovery planning for MySQL and MariaDB, if you’re unsure about RTO and RPO or whether you should you have a secondary datacenter, or are concerned about disaster recovery in the cloud…

Organizations need an appropriate disaster recovery plan in order to mitigate the impact of downtime. But how much should a business invest? Designing a highly available system comes at a cost, and not all businesses and certainly not all applications need five 9’s availability.

Vinay will explain key disaster recovery concepts and walk us through the relevant options from the MySQL & MariaDB ecosystem in order to meet different tiers of disaster recovery requirements; and demonstrate how ClusterControl can help fully automate an appropriate disaster recovery plan.

Sign up below to join the discussion!

Date, Time & Registration

Europe/MEA/APAC

Tuesday, July 24th at 09:00 BST / 10:00 CEST (Germany, France, Sweden)

Register Now

North America/LatAm

Tuesday, July 24th at 09:00 Pacific Time (US) / 12:00 Eastern Time (US)

Register Now

Agenda

  • Business Considerations for DR
    • Is 100% uptime possible?
    • Analyzing risk
    • Assessing business impact
  • Defining DR
    • Outage Timeline
    • RTO
    • RPO
    • RTO + RPO = 0 ?
  • DR Tiers
    • No offsite data
    • Database backup with no Hot Site
    • Database backup with Hot Site
    • Asynchronous replication to Hot Site
    • Synchronous replication to Hot Site
  • Implementing DR with ClusterControl
    • Demo
  • Q&A

Speaker

Vinay Joosery, CEO & Co-Founder, Severalnines

Vinay Joosery, CEO, Severalnines, is a passionate advocate and builder of concepts and business around distributed database systems. Prior to co-founding Severalnines, Vinay held the post of Vice-President EMEA at Pentaho Corporation - the Open Source BI leader. He has also held senior management roles at MySQL / Sun Microsystems / Oracle, where he headed the Global MySQL Telecoms Unit, and built the business around MySQL's High Availability and Clustering product lines. Prior to that, Vinay served as Director of Sales & Marketing at Ericsson Alzato, an Ericsson-owned venture focused on large scale real-time databases.

This webinar builds upon a related white paper written by Vinay on disaster recovery, which you can download here: https://severalnines.com/resources/whitepapers/disaster-recovery-planning-mysql-mariadb

We look forward to “seeing” you there!

Galera Cluster Recovery 101 - A Deep Dive into Network Partitioning

$
0
0

One of the cool features in Galera is automatic node provisioning and membership control. If a node fails or loses communication, it will be automatically evicted from the cluster and remain unoperational. As long as the majority of nodes are still communicating (Galera calls this PC - primary component), there is a very high chance the failed node would be able to automatically rejoin, resync and resume the replication once the connectivity is back.

Generally, all Galera nodes are equal. They hold the same data set and same role as masters, capable of handling read and write simultaneously, thanks to Galera group communication and certification-based replication plugin. Therefore, there is actually no failover from the database point-of-view due to this equilibrium. Only from the application side that would require failover, to skip the unoperational nodes while the cluster is partitioned.

In this blog post, we are going to look into understanding how Galera Cluster performs node and cluster recovery in case network partition happens. Just as a side note, we have covered a similar topic in this blog post some time back. Codership has explained Galera's recovery concept in great details in the documentation page, Node Failure and Recovery.

Node Failure and Eviction

In order to understand the recovery, we have to understand how Galera detects the node failure and eviction process first. Let's put this into a controlled test scenario so we can understand the eviction process better. Suppose we have a three-node Galera Cluster as illustrated below:

The following command can be used to retrieve our Galera provider options:

mysql> SHOW VARIABLES LIKE 'wsrep_provider_options'\G

It's a long list, but we just need to focus on some of the parameters to explain the process:

evs.inactive_check_period = PT0.5S; 
evs.inactive_timeout = PT15S; 
evs.keepalive_period = PT1S; 
evs.suspect_timeout = PT5S; 
evs.view_forget_timeout = P1D;
gmcast.peer_timeout = PT3S;

First of all, Galera follows ISO 8601 formatting to represent duration. P1D means the duration is one day, while PT15S means the duration is 15 seconds (note the time designator, T, that precedes the time value). For example if one wanted to increase evs.view_forget_timeout to 1 day and a half, one would set P1DT12H, or PT36H.

Considering all hosts haven't been configured with any firewall rules, we use the following script called block_galera.sh on galera2 to simulate a network failure to/from this node:

#!/bin/bash
# block_galera.sh
# galera2, 192.168.55.172

iptables -I INPUT -m tcp -p tcp --dport 4567 -j REJECT
iptables -I INPUT -m tcp -p tcp --dport 3306 -j REJECT
iptables -I OUTPUT -m tcp -p tcp --dport 4567 -j REJECT
iptables -I OUTPUT -m tcp -p tcp --dport 3306 -j REJECT
# print timestamp
date

By executing the script, we get the following output:

$ ./block_galera.sh
Wed Jul  4 16:46:02 UTC 2018

The reported timestamp can be considered as the start of the cluster partitioning, where we lose galera2, while galera1 and galera3 are still online and accessible. At this point, our Galera Cluster architecture is looking something like this:

From Partitioned Node Perspective

On galera2, you will see some printouts inside the MySQL error log. Let's break them out into several parts. The downtime was started around 16:46:02 UTC time and after gmcast.peer_timeout=PT3S, the following appears:

2018-07-04 16:46:05 140454904243968 [Note] WSREP: (62116b35, 'tcp://0.0.0.0:4567') connection to peer 8b2041d6 with addr tcp://192.168.55.173:4567 timed out, no messages seen in PT3S
2018-07-04 16:46:05 140454904243968 [Note] WSREP: (62116b35, 'tcp://0.0.0.0:4567') turning message relay requesting on, nonlive peers: tcp://192.168.55.173:4567
2018-07-04 16:46:06 140454904243968 [Note] WSREP: (62116b35, 'tcp://0.0.0.0:4567') connection to peer 737422d6 with addr tcp://192.168.55.171:4567 timed out, no messages seen in PT3S
2018-07-04 16:46:06 140454904243968 [Note] WSREP: (62116b35, 'tcp://0.0.0.0:4567') reconnecting to 8b2041d6 (tcp://192.168.55.173:4567), attempt 0

As it passed evs.suspect_timeout = PT5S, both nodes galera1 and galera3 are suspected as dead by galera2:

2018-07-04 16:46:07 140454904243968 [Note] WSREP: evs::proto(62116b35, OPERATIONAL, view_id(REG,62116b35,54)) suspecting node: 8b2041d6
2018-07-04 16:46:07 140454904243968 [Note] WSREP: evs::proto(62116b35, OPERATIONAL, view_id(REG,62116b35,54)) suspected node without join message, declaring inactive
2018-07-04 16:46:07 140454904243968 [Note] WSREP: (62116b35, 'tcp://0.0.0.0:4567') reconnecting to 737422d6 (tcp://192.168.55.171:4567), attempt 0
2018-07-04 16:46:08 140454904243968 [Note] WSREP: evs::proto(62116b35, GATHER, view_id(REG,62116b35,54)) suspecting node: 737422d6
2018-07-04 16:46:08 140454904243968 [Note] WSREP: evs::proto(62116b35, GATHER, view_id(REG,62116b35,54)) suspected node without join message, declaring inactive

Then, Galera will revise the current cluster view and the position of this node:

2018-07-04 16:46:09 140454904243968 [Note] WSREP: view(view_id(NON_PRIM,62116b35,54) memb {
        62116b35,0
} joined {
} left {
} partitioned {
        737422d6,0
        8b2041d6,0
})
2018-07-04 16:46:09 140454904243968 [Note] WSREP: view(view_id(NON_PRIM,62116b35,55) memb {
        62116b35,0
} joined {
} left {
} partitioned {
        737422d6,0
        8b2041d6,0
})

With the new cluster view, Galera will perform quorum calculation to decide whether this node is part of the primary component. If the new component sees "primary = no", Galera will demote the local node state from SYNCED to OPEN:

2018-07-04 16:46:09 140454288942848 [Note] WSREP: New COMPONENT: primary = no, bootstrap = no, my_idx = 0, memb_num = 1
2018-07-04 16:46:09 140454288942848 [Note] WSREP: Flow-control interval: [16, 16]
2018-07-04 16:46:09 140454288942848 [Note] WSREP: Trying to continue unpaused monitor
2018-07-04 16:46:09 140454288942848 [Note] WSREP: Received NON-PRIMARY.
2018-07-04 16:46:09 140454288942848 [Note] WSREP: Shifting SYNCED -> OPEN (TO: 2753699)

With the latest change on the cluster view and node state, Galera returns the post-eviction cluster view and global state as below:

2018-07-04 16:46:09 140454222194432 [Note] WSREP: New cluster view: global state: 55238f52-41ee-11e8-852f-3316bdb654bc:2753699, view# -1: non-Primary, number of nodes: 1, my index: 0, protocol version 3
2018-07-04 16:46:09 140454222194432 [Note] WSREP: wsrep_notify_cmd is not defined, skipping notification.

You can see the following global status of galera2 have changed during this period:

mysql> SELECT * FROM information_schema.global_status WHERE variable_name IN ('WSREP_CLUSTER_STATUS','WSREP_LOCAL_STATE_COMMENT','WSREP_CLUSTER_SIZE','WSREP_EVS_DELAYED','WSREP_READY');
+---------------------------+-----------------------------------------------------------------------------------------------------------------------------------+
| VARIABLE_NAME             | VARIABLE_VALUE                                                                                                                    |
+---------------------------+-----------------------------------------------------------------------------------------------------------------------------------+
| WSREP_CLUSTER_SIZE        | 1                                                                                                                                 |
| WSREP_CLUSTER_STATUS      | non-Primary                                                                                                                       |
| WSREP_EVS_DELAYED         | 737422d6-7db3-11e8-a2a2-bbe98913baf0:tcp://192.168.55.171:4567:1,8b2041d6-7f62-11e8-87d5-12a76678131f:tcp://192.168.55.173:4567:2 |
| WSREP_LOCAL_STATE_COMMENT | Initialized                                                                                                                       |
| WSREP_READY               | OFF                                                                                                                               |
+---------------------------+-----------------------------------------------------------------------------------------------------------------------------------+

At this point, MySQL/MariaDB server on galera2 is still accessible (database is listening on 3306 and Galera on 4567) and you can query the mysql system tables and list out the databases and tables. However when you jump into the non-system tables and make a simple query like this:

mysql> SELECT * FROM sbtest1;
ERROR 1047 (08S01): WSREP has not yet prepared node for application use

You will immediately get an error indicating WSREP is loaded but not ready to use by this node, as reported by wsrep_ready status. This is due to the node losing its connection to the Primary Component and it enters the non-operational state (the local node status was changed from SYNCED to OPEN). Data reads from nodes in a non-operational state are considered stale, unless you set wsrep_dirty_reads=ON to permit reads, although Galera still rejects any command that modifies or updates the database.

Finally, Galera will keep on listening and reconnecting to other members in the background infinitely:

2018-07-04 16:47:12 140454904243968 [Note] WSREP: (62116b35, 'tcp://0.0.0.0:4567') reconnecting to 8b2041d6 (tcp://192.168.55.173:4567), attempt 30
2018-07-04 16:47:13 140454904243968 [Note] WSREP: (62116b35, 'tcp://0.0.0.0:4567') reconnecting to 737422d6 (tcp://192.168.55.171:4567), attempt 30
2018-07-04 16:48:20 140454904243968 [Note] WSREP: (62116b35, 'tcp://0.0.0.0:4567') reconnecting to 8b2041d6 (tcp://192.168.55.173:4567), attempt 60
2018-07-04 16:48:22 140454904243968 [Note] WSREP: (62116b35, 'tcp://0.0.0.0:4567') reconnecting to 737422d6 (tcp://192.168.55.171:4567), attempt 60

The eviction process flow by Galera group communication for the partitioned node during network issue can be summarized as below:

  1. Disconnects from the cluster after gmcast.peer_timeout.
  2. Suspects other nodes after evs.suspect_timeout.
  3. Retrieves the new cluster view.
  4. Performs quorum calculation to determine the node's state.
  5. Demotes the node from SYNCED to OPEN.
  6. Attempts to reconnect to the primary component (other Galera nodes) in the background.

From Primary Component Perspective

On galera1 and galera3 respectively, after gmcast.peer_timeout=PT3S, the following appears in the MySQL error log:

2018-07-04 16:46:05 139955510687488 [Note] WSREP: (8b2041d6, 'tcp://0.0.0.0:4567') turning message relay requesting on, nonlive peers: tcp://192.168.55.172:4567
2018-07-04 16:46:06 139955510687488 [Note] WSREP: (8b2041d6, 'tcp://0.0.0.0:4567') reconnecting to 62116b35 (tcp://192.168.55.172:4567), attempt 0

After it passed evs.suspect_timeout = PT5S, galera2 is suspected as dead by galera3 (and galera1):

2018-07-04 16:46:10 139955510687488 [Note] WSREP: evs::proto(8b2041d6, OPERATIONAL, view_id(REG,62116b35,54)) suspecting node: 62116b35
2018-07-04 16:46:10 139955510687488 [Note] WSREP: evs::proto(8b2041d6, OPERATIONAL, view_id(REG,62116b35,54)) suspected node without join message, declaring inactive

Galera checks out if the other nodes respond to the group communication on galera3, it finds galera1 is in primary and stable state:

2018-07-04 16:46:11 139955510687488 [Note] WSREP: declaring 737422d6 at tcp://192.168.55.171:4567 stable
2018-07-04 16:46:11 139955510687488 [Note] WSREP: Node 737422d6 state prim

Galera revises the cluster view of this node (galera3):

2018-07-04 16:46:11 139955510687488 [Note] WSREP: view(view_id(PRIM,737422d6,55) memb {
        737422d6,0
        8b2041d6,0
} joined {
} left {
} partitioned {
        62116b35,0
})
2018-07-04 16:46:11 139955510687488 [Note] WSREP: save pc into disk

Galera then removes the partitioned node from the Primary Component:

2018-07-04 16:46:11 139955510687488 [Note] WSREP: forgetting 62116b35 (tcp://192.168.55.172:4567)

The new Primary Component is now consisted of two nodes, galera1 and galera3:

2018-07-04 16:46:11 139955502294784 [Note] WSREP: New COMPONENT: primary = yes, bootstrap = no, my_idx = 1, memb_num = 2

The Primary Component will exchange the state between each other to agree on the new cluster view and global state:

2018-07-04 16:46:11 139955502294784 [Note] WSREP: STATE EXCHANGE: Waiting for state UUID.
2018-07-04 16:46:11 139955510687488 [Note] WSREP: (8b2041d6, 'tcp://0.0.0.0:4567') turning message relay requesting off
2018-07-04 16:46:11 139955502294784 [Note] WSREP: STATE EXCHANGE: sent state msg: b3d38100-7f66-11e8-8e70-8e3bf680c993
2018-07-04 16:46:11 139955502294784 [Note] WSREP: STATE EXCHANGE: got state msg: b3d38100-7f66-11e8-8e70-8e3bf680c993 from 0 (192.168.55.171)
2018-07-04 16:46:11 139955502294784 [Note] WSREP: STATE EXCHANGE: got state msg: b3d38100-7f66-11e8-8e70-8e3bf680c993 from 1 (192.168.55.173)

Galera calculates and verifies the quorum of the state exchange between online members:

2018-07-04 16:46:11 139955502294784 [Note] WSREP: Quorum results:
        version    = 4,
        component  = PRIMARY,
        conf_id    = 27,
        members    = 2/2 (joined/total),
        act_id     = 2753703,
        last_appl. = 2753606,
        protocols  = 0/8/3 (gcs/repl/appl),
        group UUID = 55238f52-41ee-11e8-852f-3316bdb654bc
2018-07-04 16:46:11 139955502294784 [Note] WSREP: Flow-control interval: [23, 23]
2018-07-04 16:46:11 139955502294784 [Note] WSREP: Trying to continue unpaused monitor

Galera updates the new cluster view and global state after galera2 eviction:

2018-07-04 16:46:11 139955214169856 [Note] WSREP: New cluster view: global state: 55238f52-41ee-11e8-852f-3316bdb654bc:2753703, view# 28: Primary, number of nodes: 2, my index: 1, protocol version 3
2018-07-04 16:46:11 139955214169856 [Note] WSREP: wsrep_notify_cmd is not defined, skipping notification.
2018-07-04 16:46:11 139955214169856 [Note] WSREP: REPL Protocols: 8 (3, 2)
2018-07-04 16:46:11 139955214169856 [Note] WSREP: Assign initial position for certification: 2753703, protocol version: 3
2018-07-04 16:46:11 139956691814144 [Note] WSREP: Service thread queue flushed.
Clean up the partitioned node (galera2) from the active list:
2018-07-04 16:46:14 139955510687488 [Note] WSREP: cleaning up 62116b35 (tcp://192.168.55.172:4567)

At this point, both galera1 and galera3 will be reporting similar global status:

mysql> SELECT * FROM information_schema.global_status WHERE variable_name IN ('WSREP_CLUSTER_STATUS','WSREP_LOCAL_STATE_COMMENT','WSREP_CLUSTER_SIZE','WSREP_EVS_DELAYED','WSREP_READY');
+---------------------------+------------------------------------------------------------------+
| VARIABLE_NAME             | VARIABLE_VALUE                                                   |
+---------------------------+------------------------------------------------------------------+
| WSREP_CLUSTER_SIZE        | 2                                                                |
| WSREP_CLUSTER_STATUS      | Primary                                                          |
| WSREP_EVS_DELAYED         | 1491abd9-7f6d-11e8-8930-e269b03673d8:tcp://192.168.55.172:4567:1 |
| WSREP_LOCAL_STATE_COMMENT | Synced                                                           |
| WSREP_READY               | ON                                                               |
+---------------------------+------------------------------------------------------------------+

They list out the problematic member in the wsrep_evs_delayed status. Since the local state is "Synced", these nodes are operational and you can redirect the client connections from galera2 to any of them. If this step is inconvenient, consider using a load balancer sitting in front of the database to simplify the connection endpoint from the clients.

Node Recovery and Joining

A partitioned Galera node will keep on attempting to establish connection with the Primary Component infinitely. Let's flush the iptables rules on galera2 to let it connect with the remaining nodes:

# on galera2
$ iptables -F

Once the node is capable of connecting to one of the nodes, Galera will start re-establishing the group communication automatically:

2018-07-09 10:46:34 140075962705664 [Note] WSREP: (1491abd9, 'tcp://0.0.0.0:4567') connection established to 8b2041d6 tcp://192.168.55.173:4567
2018-07-09 10:46:34 140075962705664 [Note] WSREP: (1491abd9, 'tcp://0.0.0.0:4567') connection established to 737422d6 tcp://192.168.55.171:4567
2018-07-09 10:46:34 140075962705664 [Note] WSREP: declaring 737422d6 at tcp://192.168.55.171:4567 stable
2018-07-09 10:46:34 140075962705664 [Note] WSREP: declaring 8b2041d6 at tcp://192.168.55.173:4567 stable

Node galera2 will then connect to one of the Primary Component (in this case is galera1, node ID 737422d6) to get the current cluster view and nodes state:

2018-07-09 10:46:34 140075962705664 [Note] WSREP: Node 737422d6 state prim
2018-07-09 10:46:34 140075962705664 [Note] WSREP: view(view_id(PRIM,1491abd9,142) memb {
        1491abd9,0
        737422d6,0
        8b2041d6,0
} joined {
} left {
} partitioned {
})
2018-07-09 10:46:34 140075962705664 [Note] WSREP: save pc into disk

Galera will then perform state exchange with the rest of the members that can form the Primary Component:

2018-07-09 10:46:34 140075954312960 [Note] WSREP: New COMPONENT: primary = yes, bootstrap = no, my_idx = 0, memb_num = 3
2018-07-09 10:46:34 140075954312960 [Note] WSREP: STATE_EXCHANGE: sent state UUID: 4b23eaa0-8322-11e8-a87e-fe4e0fce2a5f
2018-07-09 10:46:34 140075954312960 [Note] WSREP: STATE EXCHANGE: sent state msg: 4b23eaa0-8322-11e8-a87e-fe4e0fce2a5f
2018-07-09 10:46:34 140075954312960 [Note] WSREP: STATE EXCHANGE: got state msg: 4b23eaa0-8322-11e8-a87e-fe4e0fce2a5f from 0 (192.168.55.172)
2018-07-09 10:46:34 140075954312960 [Note] WSREP: STATE EXCHANGE: got state msg: 4b23eaa0-8322-11e8-a87e-fe4e0fce2a5f from 1 (192.168.55.171)
2018-07-09 10:46:34 140075954312960 [Note] WSREP: STATE EXCHANGE: got state msg: 4b23eaa0-8322-11e8-a87e-fe4e0fce2a5f from 2 (192.168.55.173)

The state exchange allows galera2 to calculate the quorum and produce the following result:

2018-07-09 10:46:34 140075954312960 [Note] WSREP: Quorum results:
        version    = 4,
        component  = PRIMARY,
        conf_id    = 71,
        members    = 2/3 (joined/total),
        act_id     = 2836958,
        last_appl. = 0,
        protocols  = 0/8/3 (gcs/repl/appl),
        group UUID = 55238f52-41ee-11e8-852f-3316bdb654bc

Galera will then promote the local node state from OPEN to PRIMARY, to start and establish the node connection to the Primary Component:

2018-07-09 10:46:34 140075954312960 [Note] WSREP: Flow-control interval: [28, 28]
2018-07-09 10:46:34 140075954312960 [Note] WSREP: Trying to continue unpaused monitor
2018-07-09 10:46:34 140075954312960 [Note] WSREP: Shifting OPEN -> PRIMARY (TO: 2836958)

As reported by the above line, Galera calculates the gap on how far the node is behind from the cluster. This node requires state transfer to catch up to writeset number 2836958 from 2761994:

2018-07-09 10:46:34 140075929970432 [Note] WSREP: State transfer required:
        Group state: 55238f52-41ee-11e8-852f-3316bdb654bc:2836958
        Local state: 55238f52-41ee-11e8-852f-3316bdb654bc:2761994
2018-07-09 10:46:34 140075929970432 [Note] WSREP: New cluster view: global state: 55238f52-41ee-11e8-852f-3316bdb654bc:2836958, view# 72: Primary, number of nodes:
3, my index: 0, protocol version 3
2018-07-09 10:46:34 140075929970432 [Warning] WSREP: Gap in state sequence. Need state transfer.
2018-07-09 10:46:34 140075929970432 [Note] WSREP: wsrep_notify_cmd is not defined, skipping notification.
2018-07-09 10:46:34 140075929970432 [Note] WSREP: REPL Protocols: 8 (3, 2)
2018-07-09 10:46:34 140075929970432 [Note] WSREP: Assign initial position for certification: 2836958, protocol version: 3

Galera prepares the IST listener on port 4568 on this node and asks any Synced node in the cluster to become a donor. In this case, Galera automatically picks galera3 (192.168.55.173), or it could also pick a donor from the list under wsrep_sst_donor (if defined) r for the syncing operation:

2018-07-09 10:46:34 140075996276480 [Note] WSREP: Service thread queue flushed.
2018-07-09 10:46:34 140075929970432 [Note] WSREP: IST receiver addr using tcp://192.168.55.172:4568
2018-07-09 10:46:34 140075929970432 [Note] WSREP: Prepared IST receiver, listening at: tcp://192.168.55.172:4568
2018-07-09 10:46:34 140075954312960 [Note] WSREP: Member 0.0 (192.168.55.172) requested state transfer from '*any*'. Selected 2.0 (192.168.55.173)(SYNCED) as donor.

It will then change the local node state from PRIMARY to JOINER. At this stage, galera2 is granted with state transfer request and starts to cache write-sets:

2018-07-09 10:46:34 140075954312960 [Note] WSREP: Shifting PRIMARY -> JOINER (TO: 2836958)
2018-07-09 10:46:34 140075929970432 [Note] WSREP: Requesting state transfer: success, donor: 2
2018-07-09 10:46:34 140075929970432 [Note] WSREP: GCache history reset: 55238f52-41ee-11e8-852f-3316bdb654bc:2761994 -> 55238f52-41ee-11e8-852f-3316bdb654bc:2836958
2018-07-09 10:46:34 140075929970432 [Note] WSREP: GCache DEBUG: RingBuffer::seqno_reset(): full reset

Node galera2 starts receiving the missing writesets from the selected donor's gcache (galera3):

2018-07-09 10:46:34 140075954312960 [Note] WSREP: 2.0 (192.168.55.173): State transfer to 0.0 (192.168.55.172) complete.
2018-07-09 10:46:34 140075929970432 [Note] WSREP: Receiving IST: 74964 writesets, seqnos 2761994-2836958
2018-07-09 10:46:34 140075593627392 [Note] WSREP: Receiving IST...  0.0% (    0/74964 events) complete.
2018-07-09 10:46:34 140075954312960 [Note] WSREP: Member 2.0 (192.168.55.173) synced with group.
2018-07-09 10:46:34 140075962705664 [Note] WSREP: (1491abd9, 'tcp://0.0.0.0:4567') connection established to 737422d6 tcp://192.168.55.171:4567
2018-07-09 10:46:41 140075962705664 [Note] WSREP: (1491abd9, 'tcp://0.0.0.0:4567') turning message relay requesting off
2018-07-09 10:46:44 140075593627392 [Note] WSREP: Receiving IST... 36.0% (27008/74964 events) complete.
2018-07-09 10:46:54 140075593627392 [Note] WSREP: Receiving IST... 71.6% (53696/74964 events) complete.
2018-07-09 10:47:02 140075593627392 [Note] WSREP: Receiving IST...100.0% (74964/74964 events) complete.
2018-07-09 10:47:02 140075929970432 [Note] WSREP: IST received: 55238f52-41ee-11e8-852f-3316bdb654bc:2836958
2018-07-09 10:47:02 140075954312960 [Note] WSREP: 0.0 (192.168.55.172): State transfer from 2.0 (192.168.55.173) complete.

Once all the missing writesets are received and applied, Galera will promote galera2 as JOINED until seqno 2837012:

2018-07-09 10:47:02 140075954312960 [Note] WSREP: Shifting JOINER -> JOINED (TO: 2837012)
2018-07-09 10:47:02 140075954312960 [Note] WSREP: Member 0.0 (192.168.55.172) synced with group.

The node applies any cached writesets in its slave queue and finishes catching up with the cluster. Its slave queue is now empty. Galera will promote galera2 to SYNCED, indicating the node is now operational and ready to serve clients:

2018-07-09 10:47:02 140075954312960 [Note] WSREP: Shifting JOINED -> SYNCED (TO: 2837012)
2018-07-09 10:47:02 140076605892352 [Note] WSREP: Synchronized with group, ready for connections

At this point, all nodes are back operational. You can verify by using the following statements on galera2:

mysql> SELECT * FROM information_schema.global_status WHERE variable_name IN ('WSREP_CLUSTER_STATUS','WSREP_LOCAL_STATE_COMMENT','WSREP_CLUSTER_SIZE','WSREP_EVS_DELAYED','WSREP_READY');
+---------------------------+----------------+
| VARIABLE_NAME             | VARIABLE_VALUE |
+---------------------------+----------------+
| WSREP_CLUSTER_SIZE        | 3              |
| WSREP_CLUSTER_STATUS      | Primary        |
| WSREP_EVS_DELAYED         |                |
| WSREP_LOCAL_STATE_COMMENT | Synced         |
| WSREP_READY               | ON             |
+---------------------------+----------------+

The wsrep_cluster_size reported as 3 and the cluster status is Primary, indicating galera2 is part of the Primary Component. The wsrep_evs_delayed has also been cleared and the local state is now Synced.

The recovery process flow for the partitioned node during network issue can be summarized as below:

  1. Re-establishes group communication to other nodes.
  2. Retrieves the cluster view from one of the Primary Component.
  3. Performs state exchange with the Primary Component and calculates the quorum.
  4. Changes the local node state from OPEN to PRIMARY.
  5. Calculates the gap between local node and the cluster.
  6. Changes the local node state from PRIMARY to JOINER.
  7. Prepares IST listener/receiver on port 4568.
  8. Requests state transfer via IST and picks a donor.
  9. Starts receiving and applying the missing writeset from chosen donor's gcache.
  10. Changes the local node state from JOINER to JOINED.
  11. Catches up with the cluster by applying the cached writesets in the slave queue.
  12. Changes the local node state from JOINED to SYNCED.
ClusterControl
Single Console for Your Entire Database Infrastructure
Find out what else is new in ClusterControl

Cluster Failure

A Galera Cluster is considered failed if no primary component (PC) is available. Consider a similar three-node Galera Cluster as depicted in the diagram below:

A cluster is considered operational if all nodes or majority of the nodes are online. Online means they are able to see each other through Galera's replication traffic or group communication. If no traffic is coming in and out from the node, the cluster will send a heartbeat beacon for the node to response in a timely manner. Otherwise, it will be put into the delay or suspected list according to how the node responses.

If a node goes down, let's say node C, the cluster will remain operational because node A and B are still in quorum with 2 votes out of 3 to form a primary component. You should get the following cluster state on A and B:

mysql> SHOW STATUS LIKE 'wsrep_cluster_status';
+----------------------+---------+
| Variable_name        | Value   |
+----------------------+---------+
| wsrep_cluster_status | Primary |
+----------------------+---------+

If let's say a primary switch down went kaput, as illustrated in the following diagram:

At this point, every single node loses communication to each other, and the cluster state will be reported as non-Primary on all nodes (as what happened to galera2 in the previous case). Every node would calculate the quorum and find out that it is the minority (1 vote out of 3) thus losing the quorum, which means no Primary Component is formed and consequently all nodes refuse to serve any data. This is deemed as cluster failure.

Once the network issue is resolved, Galera will automatically re-establish the communication between members, exchange node's states and determine the possibility of reforming the primary component by comparing node state, UUIDs and seqnos. If the probability is there, Galera will merge the primary components as shown in the following lines:

2018-06-27  0:16:57 140203784476416 [Note] WSREP: New COMPONENT: primary = yes, bootstrap = no, my_idx = 2, memb_num = 3
2018-06-27  0:16:57 140203784476416 [Note] WSREP: STATE EXCHANGE: Waiting for state UUID.
2018-06-27  0:16:57 140203784476416 [Note] WSREP: STATE EXCHANGE: sent state msg: 5885911b-795c-11e8-8683-931c85442c7e
2018-06-27  0:16:57 140203784476416 [Note] WSREP: STATE EXCHANGE: got state msg: 5885911b-795c-11e8-8683-931c85442c7e from 0 (192.168.55.171)
2018-06-27  0:16:57 140203784476416 [Note] WSREP: STATE EXCHANGE: got state msg: 5885911b-795c-11e8-8683-931c85442c7e from 1 (192.168.55.172)
2018-06-27  0:16:57 140203784476416 [Note] WSREP: STATE EXCHANGE: got state msg: 5885911b-795c-11e8-8683-931c85442c7e from 2 (192.168.55.173)
2018-06-27  0:16:57 140203784476416 [Warning] WSREP: Quorum: No node with complete state:

        Version      : 4
        Flags        : 0x3
        Protocols    : 0 / 8 / 3
        State        : NON-PRIMARY
        Desync count : 0
        Prim state   : SYNCED
        Prim UUID    : 5224a024-791b-11e8-a0ac-8bc6118b0f96
        Prim  seqno  : 5
        First seqno  : 112714
        Last  seqno  : 112725
        Prim JOINED  : 3
        State UUID   : 5885911b-795c-11e8-8683-931c85442c7e
        Group UUID   : 55238f52-41ee-11e8-852f-3316bdb654bc
        Name         : '192.168.55.171'
        Incoming addr: '192.168.55.171:3306'

        Version      : 4
        Flags        : 0x2
        Protocols    : 0 / 8 / 3
        State        : NON-PRIMARY
        Desync count : 0
        Prim state   : SYNCED
        Prim UUID    : 5224a024-791b-11e8-a0ac-8bc6118b0f96
        Prim  seqno  : 5
        First seqno  : 112714
        Last  seqno  : 112725
        Prim JOINED  : 3
        State UUID   : 5885911b-795c-11e8-8683-931c85442c7e
        Group UUID   : 55238f52-41ee-11e8-852f-3316bdb654bc
        Name         : '192.168.55.172'
        Incoming addr: '192.168.55.172:3306'

        Version      : 4
        Flags        : 0x2
        Protocols    : 0 / 8 / 3
        State        : NON-PRIMARY
        Desync count : 0
        Prim state   : SYNCED
        Prim UUID    : 5224a024-791b-11e8-a0ac-8bc6118b0f96
        Prim  seqno  : 5
        First seqno  : 112714
        Last  seqno  : 112725
        Prim JOINED  : 3
        State UUID   : 5885911b-795c-11e8-8683-931c85442c7e
        Group UUID   : 55238f52-41ee-11e8-852f-3316bdb654bc
        Name         : '192.168.55.173'
        Incoming addr: '192.168.55.173:3306'

2018-06-27  0:16:57 140203784476416 [Note] WSREP: Full re-merge of primary 5224a024-791b-11e8-a0ac-8bc6118b0f96 found: 3 of 3.
2018-06-27  0:16:57 140203784476416 [Note] WSREP: Quorum results:
        version    = 4,
        component  = PRIMARY,
        conf_id    = 5,
        members    = 3/3 (joined/total),
        act_id     = 112725,
        last_appl. = 112722,
        protocols  = 0/8/3 (gcs/repl/appl),
        group UUID = 55238f52-41ee-11e8-852f-3316bdb654bc
2018-06-27  0:16:57 140203784476416 [Note] WSREP: Flow-control interval: [28, 28]
2018-06-27  0:16:57 140203784476416 [Note] WSREP: Trying to continue unpaused monitor
2018-06-27  0:16:57 140203784476416 [Note] WSREP: Restored state OPEN -> SYNCED (112725)
2018-06-27  0:16:57 140202564110080 [Note] WSREP: New cluster view: global state: 55238f52-41ee-11e8-852f-3316bdb654bc:112725, view# 6: Primary, number of nodes: 3, my index: 2, protocol version 3

A good indicator to know if the re-bootstrapping process is OK is by looking at the following line in the error log:

[Note] WSREP: Synchronized with group, ready for connections

ClusterControl Auto Recovery

ClusterControl comes with node and cluster automatic recovery features, because it oversees and understands the state of all nodes in the cluster. Automatic recovery is by default enabled if the cluster is deployed using ClusterControl. To enable or disable the cluster, simply clicking on the power icon in the summary bar as shown below:

Green icon means automatic recovery is turned on, while red is the opposite. You can monitor the recovery progress from the Activity -> Jobs dialog, like in this case, galera2 was totally inaccessible due to firewall blocking, thus forcing ClusterControl to report the following:

The recovery process will only be commencing after a graceful timeout (30 seconds) to give Galera node a chance to recover itself beforehand. If ClusterControl fails to recover a node or cluster, it will first pull all MySQL error logs from all accessible nodes and will raise the necessary alarms to notify the user via email or by pushing critical events to the third-party integration modules like PagerDuty, VictorOps or Slack. Manual intervention is then required. For Galera Cluster, ClusterControl will keep on trying to recover the failure until you mark the node as under maintenance, or disable the automatic recovery feature.

ClusterControl's automatic recovery is one of most favorite features as voted by our users. It helps you to take the necessary actions quickly, with a complete report on what has been attempted and recommendation steps to troubleshoot further on the issue. For users with support subscriptions, you can look for extra hands by escalating this issue to our technical support team for assistance.

Conclusion

Galera automatic node recovery and membership control are neat features to simplify the cluster management, improve the database reliability and reduce the risk of human error, as commonly haunting other open-source database replication technology like MySQL Replication, Group Replication and PostgreSQL Streaming/Logical Replication.

How to perform Schema Changes in MySQL & MariaDB in a Safe Way

$
0
0

Before you attempt to perform any schema changes on your production databases, you should make sure that you have a rock solid rollback plan; and that your change procedure has been successfully tested and validated in a separate environment. At the same time, it’s your responsibility to make sure that the change causes none or the least possible impact acceptable to the business. It’s definitely not an easy task.

In this article, we will take a look at how to perform database changes on MySQL and MariaDB in a controlled way. We will talk about some good habits in your day-to-day DBA work. We’ll focus on pre-requirements and tasks during the actual operations and problems that you may face when you deal with database schema changes. We will also talk about open source tools that may help you in the process.

Test and rollback scenarios

Backup

There are many ways to lose your data. Schema upgrade failure is one of them. Unlike application code, you can’t drop a bundle of files and declare that a new version has been successfully deployed. You also can’t just put back an older set of files to rollback your changes. Of course, you can run another SQL script to change the database again, but there are cases when the only accurate way to roll back changes is by restoring the entire database from backup.

However, what if you can’t afford to rollback your database to the latest backup, or your maintenance window is not big enough (considering system performance), so you can’t perform a full database backup before the change?

One may have a sophisticated, redundant environment, but as long as data is modified in both primary and standby locations, there is not much to do about it. Many scripts can just be run once, or the changes are impossible to undo. Most of the SQL change code falls into two groups:

  • Run once – you can’t add the same column to the table twice.
  • Impossible to undo – once you’ve dropped that column, it’s gone. You could undoubtedly restore your database, but that’s not precisely an undo.

You can tackle this problem in at least two possible ways. One would be to enable the binary log and take a backup, which is compatible with PITR. Such backup has to be full, complete and consistent. For xtrabackup, as long as it contains a full dataset, it will be PITR-compatible. For mysqldump, there is an option to make it PITR-compatible too. For smaller changes, a variation of mysqldump backup would be to take only a subset of data to change. This can be done with --where option. The backup should be part of the planned maintenance.

mysqldump -u -p --lock-all-tables --where="WHERE employee_id=100" mydb employees> backup_table_tmp_change_07132018.sql

Another possibility is to use CREATE TABLE AS SELECT.

You can store data or simple structure changes in the form of a fixed temporary table. With this approach you will get a source if you need to rollback your changes. It may be quite handy if you don’t change much data. The rollback can be done by taking data out from it. If any failures occur while copying the data to the table, it is automatically dropped and not created, so make sure that your statement creates a copy you need.

Obviously, there are some limitations too.

Because the ordering of the rows in the underlying SELECT statements cannot always be determined, CREATE TABLE ... IGNORE SELECT and CREATE TABLE ... REPLACE SELECT are flagged as unsafe for statement-based replication. Such statements produce a warning in the error log when using statement-based mode and are written to the binary log using the row-based format when using MIXED mode.

A very simple example of such method could be:

CREATE TABLE tmp_employees_change_07132018 AS SELECT * FROM employees where employee_id=100;
UPDATE employees SET salary=120000 WHERE employee_id=100;
COMMMIT;

Another interesting option may be MariaDB flashback database. When a wrong update or delete happens, and you would like to revert to a state of the database (or just a table) at a certain point in time, you may use the flashback feature.

Point-in-time rollback enables DBAs to recover data faster by rolling back transactions to a previous point in time rather than performing a restore from a backup. Based on ROW-based DML events, flashback can transform the binary log and reverse purposes. That means it can help undo given row changes fast. For instance, it can change DELETE events to INSERTs and vice versa, and it will swap WHERE and SET parts of the UPDATE events. This simple idea can dramatically speed up recovery from certain types of mistakes or disasters. For those who are familiar with the Oracle database, it’s a well known feature. The limitation of MariaDB flashback is the lack of DDL support.

Create a delayed replication slave

Since version 5.6, MySQL supports delayed replication. A slave server can lag behind the master by at least a specified amount of time. The default delay is 0 seconds. Use the MASTER_DELAY option for CHANGE MASTER TO to set the delay to N seconds:

CHANGE MASTER TO MASTER_DELAY = N;

It would be a good option if you didn’t have time to prepare a proper recovery scenario. You need to have enough delay to notice the problematic change. The advantage of this approach is that you don’t need to restore your database to take out data needed to fix your change. Standby DB is up and running, ready to pick up data which minimizes the time needed.

Create an asynchronous slave which is not part of the cluster

When it comes to Galera cluster, testing changes is not easy. All nodes run the same data, and heavy load can harm flow control. So you not only need to check if changes applied successfully, but also what the impact to the cluster state was. To make your test procedure as close as possible to the production workload, you may want to add an asynchronous slave to your cluster and run your test there. The test will not impact synchronization between cluster nodes, because technically it’s not part of the cluster, but you will have an option to check it with real data. Such slave can be easily added from ClusterControl.

ClusterControl add asynchronous slave

As shown in the above screenshot, ClusterControl can automate the process of adding an asynchronous slave in a few ways. You can add the node to the cluster, delay the slave. To reduce the impact on the master, you can use an existing backup instead of the master as the data source when building the slave.

Clone database and measure time

A good test should be as close as possible to the production change. The best way to do this is to clone your existing environment.

ClusterControl Clone Cluster for test

Perform changes via replication

To have better control over your changes, you can apply them on a slave server ahead of time and then do the switchover. For statement-based replication, this works fine, but for row-based replication, this can work up to a certain degree. Row-based replication enables extra columns to exist at the end of the table, so as long as it can write the first columns, it will be fine. First apply these setting to all slaves, then failover to one of the slaves and then implement the change to the master and attach that as a slave. If your modification involves inserting or removing a column in the middle of the table, it will work with row-based replication.

Operation

During the maintenance window, we do not want to have application traffic on the database. Sometimes it is hard to shut down all applications spread over the whole company. Alternatively, we want to allow only some specific hosts to access MySQL from remote (for example the monitoring system or the backup server). For this purpose, we can use the Linux packet filtering. To see what packet filtering rules are available, we can run the following command:

iptables -L INPUT -v

To close the MySQL port on all interfaces we use:

iptables -A INPUT -p tcp --dport mysql -j DROP

and to open the MySQL port again after the maintenance window:

iptables -D INPUT -p tcp --dport mysql -j DROP

For those without root access, you can change max_connection to 1 or 'skip networking'.

Logging

To get the logging process started, use the tee command at the MySQL client prompt, like this:

mysql> tee /tmp/my.out;

That command tells MySQL to log both the input and output of your current MySQL login session to a file named /tmp/my.out .Then execute your script file with source command.

To get a better idea of your execution times, you can combine it with the profiler feature. Start the profiler with

SET profiling = 1;

Then execute your Query with

SHOW PROFILES;

you see a list of queries the profiler has statistics for. So finally, you choose which query to examine with

SHOW PROFILE FOR QUERY 1;

Schema migration tools

Many times, a straight ALTER on the master is not possible - most of the cases it causes lag on the slave, and this may not be acceptable to the applications. What can be done, though, is to execute the change in a rolling mode. You can start with slaves and, once the change is applied to the slave, migrate one of the slaves as a new master, demote the old master to a slave and execute the change on it.

A tool that may help with such a task is Percona’s pt-online-schema-change. Pt-online-schema-change is straightforward - it creates a temporary table with the desired new schema (for instance, if we added an index, or removed a column from a table). Then, it creates triggers on the old table. Those triggers are there to mirror changes that happen on the original table to the new table. Changes are mirrored during the schema change process. If a row is added to the original table, it is also added to the new one. It emulates the way that MySQL alters tables internally, but it works on a copy of the table you wish to alter. It means that the original table is not locked, and clients may continue to read and change data in it.

Likewise, if a row is modified or deleted on the old table, it is also applied in the new table. Then, a background process of copying data (using LOW_PRIORITY INSERT) between old and new table begins. Once data has been copied, RENAME TABLE is executed.

Another intresting tool is gh-ost. Gh-ost creates a temporary table with the altered schema, just like pt-online-schema-change does. It executes INSERT queries, which use the following pattern to copy data from old to new table. Nevertheless it does not use triggers. Unfortunately triggers may be the source of many limitations. gh-ost uses the binary log stream to capture table changes and asynchronously applies them onto the ghost table. Once we verified that gh-ost can execute our schema change correctly, it’s time to actually execute it. Keep in mind that you may need to manually drop old tables that were created by gh-ost during the process of testing the migration. You can also use --initially-drop-ghost-table and --initially-drop-old-table flags to ask gh-ost to do it for you. The final command to execute is exactly the same as we used to test our change, we just added --execute to it.

pt-online-schema-change and gh-ost are very popular among Galera users. Nevertheless Galera has some additional options.The two methods Total Order Isolation (TOI) and Rolling Schema Upgrade (RSU) have both their pros and cons.

TOI - This is the default DDL replication method. The node that originates the writeset detects DDL at parsing time and sends out a replication event for the SQL statement before even starting the DDL processing. Schema upgrades run on all cluster nodes in the same total order sequence, preventing other transactions from committing for the duration of the operation. This method is good when you want your online schema upgrades to replicate through the cluster and don’t mind locking the entire table (similar to how default schema changes happened in MySQL).

SET GLOBAL wsrep_OSU_method='TOI';

RSU - perfom the schema upgrades locally. In this method, your writes are affecting only the node on which they are run. The changes do not replicate to the rest of the cluster.This method is good for non-conflicting operations and it will not slow down the cluster.

SET GLOBAL wsrep_OSU_method='RSU';

While the node processes the schema upgrade, it desynchronizes with the cluster. When it finishes processing the schema upgrade, it applies delayed replication events and synchronizes itself with the cluster. This could be a good option to run heavy index creations.

Conclusion

We presented here several different methods that may help you with planning your schema changes. Of course it all depends on your application and business requirements. You can design your change plan, perform necessary tests, but there is still a small chance that something will go wrong. According to Murphy’s law - “things will go wrong in any given situation, if you give them a chance”. So make sure you try out different ways of performing these changes, and pick the one that you are the most comfortable with.

How to Control Replication Failover for MySQL and MariaDB

$
0
0

Automated failover is pretty much a must have for many applications - uptime is taken for granted. It’s quite hard to accept that an application is down for 20 or 30 minutes because someone has to be paged to log in and investigate the situation before taking action.

In the real world, replication setups tend to grow over time to become complex, sometimes messy. And there are constraints. For instance, not every node in a setup makes a good master candidate. Maybe the hardware differs and some of the replicas have less powerful hardware as they are dedicated to handle some specific types of the workload? Maybe you are in the middle of migration to a new MySQL version and some of the slaves have already been upgraded? You’d rather not have a master in more recent version replicating to old replicas, as this can break replication. If you have two datacenters, one active and one for disaster recovery, you may prefer to pick master candidates only in the active datacenter, to keep the master close to the application hosts. Those are just example situations, where you may find yourself in need of manual intervention during the failover process. Luckily, many failover tools have an option to take control of the process by using whitelists and blacklists. In this blog post, we’d like to show you some examples how you can influence ClusterControl’s algorithm for picking master candidates.

Whitelist and Blacklist Configuration

ClusterControl gives you an option to define both whitelist and blacklist of replicas. A whitelist is a list of replicas which are intended to become master candidates. If none of them are available (either because they are down, or there are errant transactions, or there are other obstacles that prevent any of them from being promoted), failover will not be performed. In this way, you can define which hosts are available to become a master candidate. Blacklists, on the other hand, define which replicas are not suitable to become a master candidate.

Both of those lists can be defined in the cmon configuration file for a given cluster. For example, if your cluster has id of ‘1’, you want to edit ‘/etc/cmon.d/cmon_1.cnf’. For whitelist you will use ‘replication_failover_whitelist’ variable, for blacklist it will be a ‘replication_failover_blacklist’. Both accept a comma separated list of ‘host:port’.

Let’s consider the following replication setup. We have an active master (10.0.0.141) which has two replicas (10.0.0.142 and 10.0.0.143), both act as intermediate masters and have one replica each (10.0.0.144 and 10.0.0.147). We also have a standby master in a separate datacenter (10.0.0.145) which has a replica (10.0.0.146). Those hosts are intended to be used in case of a disaster. Replicas 10.0.0.146 and 10.0.0.147 act as backup hosts. See below screenshot.

Given that the second datacenter is only intended for disaster recovery, we don’t want any of those hosts to be promoted as master. In the worst case scenario, we will take manual action. The second datacenter’s infrastructure is not scaled to the size of the production datacenter (there are three replicas less in the DR datacenter), so manual actions are needed anyway before we can promote a host in the DR datacenter. We also would not like for a backup replica (10.0.0.147) to be promoted. Neither we want a third replica in the chain to be picked up as a master (even though it could be done with GTID).

Whitelist Configuration

We can configure either whitelist or a blacklist to make sure that failover will be handled to our liking. In this particular setup, using whitelist may be more suitable - we will define which hosts can be used for failover and if someone adds a new host to the setup, it will not be taken under consideration as master candidate until someone will manually decide it is ok to use it and add it to the whitelist. If we used blacklist, adding a new replica somewhere in the chain could mean that such replica could theoretically be automatically used for failover unless someone explicitly says it cannot be used. Let’s stay on the safe side and define a whitelist in our cluster configuration file (in this case it is /etc/cmon.d/cmon_1.cnf as we have just one cluster):

replication_failover_whitelist=10.0.0.141:3306,10.0.0.142:3306,10.0.0.143:3306

We have to make sure that the cmon process has been restarted to apply changes:

service cmon restart

Let’s assume our master has crashed and cannot be reached by ClusterControl. A failover job will be initiated:

The topology will look like below:

As you can see, the old master is disabled and ClusterControl will not attempt to automatically recover it. It is up to the user to check what has happened, copy any data which may not have been replicated to the master candidate and rebuild the old master:

Then it’s a matter of a few topology changes and we can bring the topology to the original state, just replacing 10.0.0.141 with 10.0.0.142:

Blacklist Configuration

Now we are going to see how the blacklist works. We mentioned that, in our example, it may not be the best option but we will try it for the sake of illustration. We will blacklist every host except 10.0.0.141, 10.0.0.142 and 10.0.0.143 as those are the hosts we want to see as master candidates.

replication_failover_blacklist=10.0.0.145:3306,10.0.0.146:3306,10.0.0.144:3306,10.0.0.147:3306

We will also restart the cmon process to apply configuration changes:

service cmon restart

The failover process is similar. Again, once the master crash is detected, ClusterControl will start a failover job.

ClusterControl
Single Console for Your Entire Database Infrastructure
Find out what else is new in ClusterControl

When a Replica May Not be a Good Master Candidate

In this short section, we would like to discuss in more details some of the cases in which you may not want to promote a given replica to become a new master. Hopefully, this will give you some ideas of the cases where you may need to consider inducing more manual control of the failover process.

Different MySQL Version

First, if your replica uses a different MySQL version than the master, it is not a good idea to promote it. Generally speaking, a more recent version is always a no-go as replication from the new to the old MySQL version is not supported and may not work correctly. This is relevant mostly to major versions (for example, 8.0 replicating to 5.7) but the good practice is to avoid this setup altogether, even if we are talking about small version differences (5.7.x+1 -> 5.7.x). Replicating from lower to higher/newer version is supported as it is a must for the upgrade process, but still, you would rather want to avoid this (for example, if your master is on 5.7.x+1 you would rather not replace it with a replica on 5.7.x).

Different Roles

You may assign different roles to your replicas. You can pick one of them to be available for developers to test their queries on a production dataset. You may use one of them for OLAP workload. You may use one of them for backups. No matter what it is, typically you would not want to promote such replica to master. All of those additional, non-standard workloads may cause performance problems due to the additional overhead. A good choice for a master candidate is a replica which is handling “normal” load, more or less the same type of load as the current master. You can then be certain it will handle the master load after failover if it handled it before that.

Different Hardware Specifications

We mentioned different roles for replicas. It is not uncommon to see different hardware specifications too, especially in conjunction with different roles. For example, a backup slave most likely doesn’t have to be as powerful as a regular replica. Developers may also test their queries on a slower database than the production (mostly because you would not expect the same level of concurrency on development and production database) and, for example, CPU core count can be reduced. Disaster recovery setups may also be reduced in size if their main role would be to keep up with the replication and it is expected that DR setup will have to be scaled (both vertically, by sizing up the instance and horizontally, by adding more replicas) before traffic can be redirected to it.

Delayed Replicas

Some of the replicas may be delayed - it is a very good way of reducing recovery time if data has been lost, but it makes them very bad master candidates. If a replica is delayed by 30 minutes, you will either lose that 30 minutes of transactions or you will have to wait (probably not 30 minutes as, most likely, the replica can catch up faster) for the replica to apply all delayed transactions. ClusterControl allows you to pick if you want to wait or if you want to failover immediately, but this would work ok for a very small lag - tens of seconds at most. If failover is supposed to take minutes, it’s just no point on using such a replica and therefore it’s a good idea to blacklist it.

Different Datacenter

We mentioned scaled-down DR setups but even if your second datacenter is scaled to the size of production, it still may be a good idea to keep the failovers within a single DC only. For starters, your active application hosts may be located in the main datacenter thus moving the master to a standby DC would significantly increase latency for write queries. Also, in case of a network split, you may want to manually handle this situation. MySQL does not have a quorum mechanism built in therefore it is kind of tricky to correctly handle (in an automatic way) network loss between two datacenters.

Controlling Replication Failover for MySQL and MariaDB with Pre- or Post-Failover Scripts

$
0
0

In a previous post, we discussed how you can take control of the failover process in ClusterControl by utilizing whitelists and blacklists. In this post, we are going to discuss a similar concept. But this time we will focus on integrations with external scripts and applications through numerous hooks made available by ClusterControl.

Infrastructure environments can be built in different ways, as oftentimes there are many options to choose from for a given piece of the puzzle. How do we define which database node to write to? Do you use virtual IP? Do you use some sort of service discovery? Maybe you go with DNS entries and change the A records when needed? What about the proxy layer? Do you rely on ‘read_only’ value for your proxies to decide on the writer, or maybe you make the required changes directly in the configuration of the proxy? How does your environment handle switchovers? Can you just go ahead and execute it, or maybe you have to take some preliminary actions beforehand? For instance, halting some other processes before you can actually do the switch?

It is not possible for a failover software to be preconfigured to cover all of the different setups that people can create. This is main reason to provide different ways of hooking into the failover process. This way you can customize it and make it possible to handle all of the subtleties of your setup. In this blog post, we will look into how ClusterControl’s failover process can be customized using different pre- and post-failover scripts. We will also discuss some examples of what can be accomplished with such customization.

Integrating ClusterControl

ClusterControl provides several hooks that can be used to plug in external scripts. Below you will find a list of those with some explanation.

  1. Replication_onfail_failover_script - this script executes as soon as it has been discovered that a failover is needed. If the script returns non-zero, it will force the failover to abort. If the script is defined but not found, the failover will be aborted. Four arguments are supplied to the script: arg1='all servers' arg2='oldmaster' arg3='candidate', arg4='slaves of oldmaster' and passed like this: 'scripname arg1 arg2 arg3 arg4'. The script must be accessible on the controller and be executable.
  2. Replication_pre_failover_script - this script executes before the failover happens, but after a candidate has been elected and it is possible to continue the failover process. If the script returns non-zero it will force the failover to abort. If the script is defined but not found, the failover will be aborted. The script must be accessible on the controller and be executable.
  3. Replication_post_failover_script - this script executes after the failover happened. If the script returns non-zero, a Warning will be written in the job log. The script must be accessible on the controller and be executable.
  4. Replication_post_unsuccessful_failover_script - This script is executed after the failover attempt failed. If the script returns non-zero, a Warning will be written in the job log. The script must be accessible on the controller and be executable.
  5. Replication_failed_reslave_failover_script - this script is executed after that a new master has been promoted and if the reslaving of the slaves to the new master fails. If the script returns non-zero, a Warning will be written in the job log. The script must be accessible on the controller and be executable.
  6. Replication_pre_switchover_script - this script executes before the switchover happens. If the script returns non-zero, it will force the switchover to fail. If the script is defined but not found, the switchover will be aborted. The script must be accessible on the controller and be executable.
  7. Replication_post_switchover_script - this script executes after the switchover happened. If the script returns non-zero, a Warning will be written in the job log. The script must be accessible on the controller and be executable.

As you can see, the hooks cover most of the cases where you may want to take some actions - before and after a switchover, before and after a failover, when the reslave has failed or when the failover has failed. All of the scripts are invoked with four arguments (which may or may not be handled in the script, it is not required for the script to utilize all of them): all servers, hostname (or IP - as it is defined in ClusterControl) of the old master, hostname (or IP - as it is defined in ClusterControl) of the master candidate and the fourth one, all replicas of the old master. Those options should make it possible to handle the majority of the cases.

All of those hooks should be defined in a configuration file for a given cluster (/etc/cmon.d/cmon_X.cnf where X is the id of the cluster). An example may look like this:

replication_pre_failover_script=/usr/bin/stonith.py
replication_post_failover_script=/usr/bin/vipmove.sh

Of course, invoked scripts have to be executable, otherwise cmon won’t be able to execute them. Let’s now take a moment and go through the failover process in ClusterControl and see when the external scripts are executed.

Failover process in ClusterControl

We defined all of the hooks that are available:

replication_onfail_failover_script=/tmp/1.sh
replication_pre_failover_script=/tmp/2.sh
replication_post_failover_script=/tmp/3.sh
replication_post_unsuccessful_failover_script=/tmp/4.sh
replication_failed_reslave_failover_script=/tmp/5.sh
replication_pre_switchover_script=/tmp/6.sh
replication_post_switchover_script=/tmp/7.sh

After this, you have to restart the cmon process. Once it’s done, we are ready to test the failover. The original topology looks like this:

A master has been killed and the failover process started. Please note, the more recent log entries are at the top so you want to follow the failover from bottom to the top.

As you can see, immediately after the failover job started, it triggers the ‘replication_onfail_failover_script’ hook. Then, all reachable hosts are marked as read_only and ClusterControl attempts to prevent the old master from running.

Next, the master candidate is picked, sanity checks are executed. Once it is confirmed the master candidate can be used as a new master, the ‘replication_pre_failover_script’ is executed.

More checks are performed, replicas are stopped and slaved off the new master. Finally, after the failover completed, a final hook, ‘replication_post_failover_script’, is triggered.

When hooks can be useful?

In this section, we’ll go through a couple of examples cases where it might be a good idea to implement external scripts. We will not get into any details as those are too closely related to a particular environment. It will be more of a list of suggestions that might be useful to implement.

STONITH script

Shoot The Other Node In The Head (STONITH) is a process of making sure that the old master, which is dead, will stay dead (and yes.. we don’t like zombies roaming about in our infrastructure). The last thing you probably want is to have an unresponsive old master which then gets back online and, as a result, you end up with two writable masters. There are precautions you can take to make sure the old master will not be used even if shows up again, and it is safer for it to stay offline. Ways on how to ensure it will differ from environment to environment. Therefore, most likely, there will be no built-in support for STONITH in the failover tool. Depending on the environment, you may want to execute CLI command which will stop (and even remove) a VM on which the old master is running. If you have an on-prem setup, you may have more control over the hardware. It might be possible to utilize some sort of remote management (integrated Lights-out or some other remote access to the server). You may have also access to manageable power sockets and turn off the power in one of them to make sure server will never start again without human intervention.

Service discovery

We already mentioned a bit about service discovery. There are numerous ways one can store information about a replication topology and detect which host is a master. Definitely, one of the more popular options is to use etc.d or Consul to store data about current topology. With it, an application or proxy can rely in this data to send the traffic to the correct node. ClusterControl (just like most of the tools which do support failover handling) does not have a direct integration with either etc.d or Consul. The task to update the topology data is on the user. She can use hooks like replication_post_failover_script or replication_post_switchover_script to invoke some of the scripts and do the required changes. Another pretty common solution is to use DNS to direct traffic to correct instances. If you will keep the Time-To-Live of a DNS record low, you should be able to define a domain, which will point to your master (i.e. writes.cluster1.example.com). This requires a change to the DNS records and, again, hooks like replication_post_failover_script or replication_post_switchover_script can be really helpful to make required modifications after a failover happened.

Proxy reconfiguration

Each proxy server that is used has to send traffic to correct instances. Depending on the proxy itself, how a master detection is performed can be either (partially) hardcoded or can be up to the user to define whatever she likes. ClusterControl failover mechanism is designed in a way it integrates well with proxies that it deployed and configured. It still may happen that there are proxies in place, which were not installed by ClusterControl and they require some manual actions to take place while failover is being executed. Such proxies can also be integrated with the ClusterControl failover process through external scripts and hooks like replication_post_failover_script or replication_post_switchover_script.

Additional logging

It may happen that you’d like to collect data of the failover process for debugging purposes. ClusterControl has extensive printouts to make sure it is possible to follow the process and figure out what happened and why. It still may happen that you would like to collect some additional, custom information. Basically all of the hooks can be utilized here - you can collect the initial state, before the failover, you can track the state of the environment at all stages of the failover.

6 Common Failure Scenarios for MySQL & MariaDB, and How to Fix Them

$
0
0

It this blog post, we will analyze 6 different failure scenarios in production database systems, ranging from single-server issues to multi-datacenter failover plans. We will walk you through recovery and failover procedures for the respective scenario. Hopefully, this will give you a good understanding of the risks you might face and things to consider when designing your infrastructure.

Database schema corrupted

Let's start with single node installation - a database setup in the simplest form. Easy to implement, at the lowest cost. In this scenario, you run multiple applications on the single server where each of the database schemas belongs to the different application. The approach for recovery of a single schema would depend on several factors.

  • Do I have any backup?
  • Do I have a backup and how fast can I restore it?
  • What kind of storage engine is in use?
  • Do I have a PITR-compatible (point in time recovery) backup?

Data corruption can be identified by mysqlcheck.

mysqlcheck -uroot -p <DATABASE>

Replace DATABASE with the name of the database, and replace TABLE with the name of the table that you want to check:

mysqlcheck -uroot -p <DATABASE> <TABLE>

Mysqlcheck checks the specified database and tables. If a table passes the check, mysqlcheck displays OK for the table. In below example, we can see that the table salaries requires recovery.

employees.departments                              OK
employees.dept_emp                                 OK
employees.dept_manager                             OK
employees.employees                                OK
Employees.salaries
Warning  : Tablespace is missing for table 'employees/salaries'
Error    : Table 'employees.salaries' doesn't exist in engine
status   : Operation failed
employees.titles                                   OK

For a single node installation with no additional DR servers, the primary approach would be to restore data from backup. But this is not the only thing you need to consider. Having multiple database schema under the same instance causes an issue when you have to bring your server down to restore data. Another question is if you can afford to rollback all of your databases to the last backup. In most cases, that would not be possible.

There are some exceptions here. It is possible to restore a single table or database from the last backup when point in time recovery is not needed. Such process is more complicated. If you have mysqldump, you can extract your database from it. If you run binary backups with xtradbackup or mariabackup and you have enabled table per file, then it is possible.

Here is how to check if you have a table per file option enabled.

mysql> SET GLOBAL innodb_file_per_table=1; 

With innodb_file_per_table enabled, you can store InnoDB tables in a tbl_name .ibd file. Unlike the MyISAM storage engine, with its separate tbl_name .MYD and tbl_name .MYI files for indexes and data, InnoDB stores the data and the indexes together in a single .ibd file. To check your storage engine you need to run:

mysql> select table_name,engine from information_schema.tables where table_name='table_name' and table_schema='database_name';

or directly from the console:

[root@master ~]# mysql -u<username> -p -D<database_name> -e "show table status\G"
Enter password: 
*************************** 1. row ***************************
           Name: test1
         Engine: InnoDB
        Version: 10
     Row_format: Dynamic
           Rows: 12
 Avg_row_length: 1365
    Data_length: 16384
Max_data_length: 0
   Index_length: 0
      Data_free: 0
 Auto_increment: NULL
    Create_time: 2018-05-24 17:54:33
    Update_time: NULL
     Check_time: NULL
      Collation: latin1_swedish_ci
       Checksum: NULL
 Create_options: 
        Comment: 

To restore tables from xtradbackup, you need to go through an export process. Backup needs to be prepared before it can be restored. Exporting is done in the preparation stage. Once a full backup is created, run standard prepare procedure with the additional flag --export :

innobackupex --apply-log --export /u01/backup

This will create additional export files which you will use later on in the import phase. To import a table to another server, first create a new table with the same structure as the one that will be imported at that server:

mysql> CREATE TABLE corrupted_table (...) ENGINE=InnoDB;

discard the tablespace:

mysql> ALTER TABLE mydatabase.mytable DISCARD TABLESPACE;

Then copy mytable.ibd and mytable.exp files to database’s home, and import its tablespace:

mysql> ALTER TABLE mydatabase.mytable IMPORT TABLESPACE;

However to do this in a more controlled way, the recommendation would be to restore a database backup in other instance/server and copy what is needed back to the main system. To do so, you need to run the installation of the mysql instance. This could be done either on the same machine - but requires more effort to configure in a way that both instances can run on the same machine - for example, that would require different communication settings.

You can combine both task restore and installation using ClusterControl.

ClusterControl will walk you through the available backups on-prem or in the cloud, let you choose exact time for a restore or the precise log position, and install a new database instance if needed.

ClusterControl point in time recovery
ClusterControl restore and verify on a standalone host
CusterControl restore and verify on a standalone host. Installation options.

You can find more information about data recovery in blog My MySQL Database is Corrupted... What Do I Do Now?

Database instance corrupted on the dedicated server

Defects in the underlying platform are often the cause for database corruption. Your MySQL instance relies on a number of things to store and retrieve data - disk subsystem, controllers, communication channels, drivers and firmware. A crash can affect parts of your data, mysql binaries or even backup files that you store on the system. To separate different applications, you can place them on dedicated servers.

Different application schemas on separate systems is a good idea if you can afford them. One may say that this is a waste of resources, but there is a chance that the business impact will be less if only one of them goes down. But even then, you need to protect your database from data loss. Storing backup on the same server is not a bad idea as long you have a copy somewhere else. These days, cloud storage is an excellent alternative to tape backup.

ClusterControl enables you to keep a copy of your backup in the cloud. It supports uploading to the top 3 cloud providers - Amazon AWS, Google Cloud, and Microsoft Azure.

When you have your full backup restored, you may want to restore it to certain point in time. Point-in-time recovery will bring server up to date to a more recent time than when the full backup was taken. To do so, you need to have your binary logs enabled. You can check available binary logs with:

mysql> SHOW BINARY LOGS;

And current log file with:

SHOW MASTER STATUS;

Then you can capture incremental data by passing binary logs into sql file. Missing operations can be then re-executed.

mysqlbinlog --start-position='14231131' --verbose /var/lib/mysql/binlog.000010 /var/lib/mysql/binlog.000011 /var/lib/mysql/binlog.000012 /var/lib/mysql/binlog.000013 /var/lib/mysql/binlog.000015 > binlog.out

The same can be done in ClusterControl.

ClusterControl cloud backup

Database slave goes down

Ok, so you have your database running on a dedicated server. You created a sophisticated backup schedule with a combination of full and incremental backups, upload them to the cloud and store the latest backup on local disks for fast recovery. You have different backup retention policies - shorter for backups stored on local disk drivers and extended for your cloud backups.

It sounds like you are well prepared for a disaster scenario. But when it comes to the restore time, it may not satisfy your business needs.

You need a quick failover function. A server that will be up and running applying binary logs from the master where writes happen. Master/Slave replication starts a new chapter in the failover scenario. It's a fast method to bring your application back to life if you master goes down.

But there are few things to consider in the failover scenario. One is to setup a delayed replication slave, so you can react to fat finger commands that were triggered on the master server. A slave server can lag behind the master by at least a specified amount of time. The default delay is 0 seconds. Use the MASTER_DELAY option for CHANGE MASTER TO to set the delay to N seconds:

CHANGE MASTER TO MASTER_DELAY = N;

Second is to enable automated failover. There are many automated failover solutions on the market. You can set up automatic failover with command line tools like MHA, MRM, mysqlfailover or GUI Orchestrator and ClusterControl. When it's set up correctly, it can significantly reduce your outage.

ClusterControl supports automated failover for MySQL, PostgreSQL and MongoDB replications as well as multi-master cluster solutions Galera and NDB.

ClusterControl replication topology view

When a slave node crashes and the server is severely lagging behind, you may want to rebuild your slave server. The slave rebuild process is similar to restoring from backup.

ClusterControl rebuild slave

Database multi-master server goes down

Now when you have slave server acting as a DR node, and your failover process is well automated and tested, your DBA life becomes more comfortable. That's true, but there are a few more puzzles to solve. Computing power is not free, and your business team may ask you to better utilize your hardware, you may want to use your slave server not only as passive server, but also to serve write operations.

You may then want to investigate a multi-master replication solution. Galera Cluster has become a mainstream option for high availability MySQL and MariaDB. And though it is now known as a credible replacement for traditional MySQL master-slave architectures, it is not a drop-in replacement.

Galera cluster has a shared nothing architecture. Instead of shared disks, Galera uses certification based replication with group communication and transaction ordering to achieve synchronous replication. A database cluster should be able to survive a loss of a node, although it's achieved in different ways. In case of Galera, the critical aspect is the number of nodes. Galera requires a quorum to stay operational. A three node cluster can survive the crash of one node. With more nodes in your cluster, you can survive more failures.

Recovery process is automated so you don’t need to perfom any failover operations. However the good practice would be to kill nodes and see how fast you can bring them back. In order to make this operation more efficient, you can modify the galera cache size. If the galera cache size is not properly planned, your next booting node will have to take a full backup instead of only missing write-sets in the cache.

The failover scenario is simple as starting the intance. Based on the data in the galera cache, the booting node will perfom SST (restore from full backup) or IST (apply missing write-sets). However, this is often linked to human intervention. If you want to automate the entire failover process, you can use ClusterControl’s autorecovery functionality (node and cluster level).

ClusterControl cluster autorecovery

Estimate galera cache size:

MariaDB [(none)]> SET @start := (SELECT SUM(VARIABLE_VALUE/1024/1024) FROM information_schema.global_status WHERE VARIABLE_NAME LIKE 'WSREP%bytes'); do sleep(60); SET @end := (SELECT SUM(VARIABLE_VALUE/1024/1024) FROM information_schema.global_status WHERE VARIABLE_NAME LIKE 'WSREP%bytes'); SET @gcache := (SELECT SUBSTRING_INDEX(SUBSTRING_INDEX(@@GLOBAL.wsrep_provider_options,'gcache.size = ',-1), 'M', 1)); SELECT ROUND((@end - @start),2) AS `MB/min`, ROUND((@end - @start),2) * 60 as `MB/hour`, @gcache as `gcache Size(MB)`, ROUND(@gcache/round((@end - @start),2),2) as `Time to full(minutes)`;

To make failover more consistent, you should enable gcache.recover=yes in mycnf. This option will revive the galera-cache on restart. This means the node can act as a DONOR and service missing write-sets (facilitating IST, instead of using SST).

2018-07-20  8:59:44 139656049956608 [Note] WSREP: Quorum results:
    version    = 4,
    component  = PRIMARY,
    conf_id    = 2,
    members    = 2/3 (joined/total),
    act_id     = 12810,
    last_appl. = 0,
    protocols  = 0/7/3 (gcs/repl/appl),
    group UUID = 49eca8f8-0e3a-11e8-be4a-e7e3fe48cb69
2018-07-20  8:59:44 139656049956608 [Note] WSREP: Flow-control interval: [28, 28]
2018-07-20  8:59:44 139656049956608 [Note] WSREP: Trying to continue unpaused monitor
2018-07-20  8:59:44 139657311033088 [Note] WSREP: New cluster view: global state: 49eca8f8-0e3a-11e8-be4a-e7e3fe48cb69:12810, view# 3: Primary, number of nodes: 3, my index: 1, protocol version 3

Proxy SQL node goes down

If you have a virtual IP setup, all you have to do is to point your application to the virtual IP address and everything should be correct connection wise. It’s not enough to have your database instances spanning across multiple datacenters, you still need your applications to access them. Assume you have scaled out the number of read replicas, you might want to implement virtual IPs for each of those read replicas as well because of maintenance or availability reasons. It might become a cumbersome pool of virtual IPs that you have to manage. If one of those read replicas face a crash, you need to re-assign the virtual IP to the different host, or else your application will connect to either a host that is down or in the worst case, a lagging server with stale data.

ClusterControl HA load balancers topology view

Crashes are not frequent, but more probable than servers going down. If for whatever reason, a slave goes down, something like ProxySQL will redirect all of the traffic to the master, with the risk of overloading it. When the slave recovers, traffic will be redirected back to it. Usually, such downtime shouldn’t take more than a couple of minutes, so the overall severity is medium, even though the probability is also medium.

To have your load balancer components redundant, you can use keepalived.

ClusterControl: Deploy keepalived for ProxySQL load balancer

Datacenter goes down

The main problem with replication is that there is no majority mechanism to detect a datacenter failure and serve a new master. One of the resolutions is to use Orchestrator/Raft. Orchestrator is a topology supervisor that can control failovers. When used along with Raft, Orchestrator will become quorum-aware. One of the Orchestrator instances is elected as a leader and executes recovery tasks. The connection between orchestrator node does not correlate to transactional database commits and is sparse.

Orchestrator/Raft can use extra instances which perfom monitoring of the topology. In the case of network partitioning, the partitioned Orchestrator instances won’t take any action. The part of the Orchestrator cluster which has the quorum will elect a new master and make the necessary topology changes.

ClusterControl is used for management, scaling and, what’s most important, node recovery - Orchestrator would handle failovers, but if a slave would crash, ClusterControl will make sure it will be recovered. Orchestrator and ClusterControl would be located in the same availability zone, separated from the MySQL nodes, to make sure their activity won’t be affected by network splits between availability zones in the data center.


Asynchronous Replication Between MySQL Galera Clusters - Failover and Failback

$
0
0

Galera Cluster enforces strong data consistency, where all nodes in the cluster are tightly coupled. Although network segmentation is supported, replication performance is still bound by two factors:

  • Round trip time (RTT) to the farthest node in the cluster from the originator node.
  • The size of a writeset to be transferred and certified for conflict on the receiver node.

While there are ways to boost the performance of Galera, it is not possible to work around these 2 limiting factors.

Luckily, Galera Cluster was built on top of MySQL, which also comes with its built-in replication feature (duh!). Both Galera replication and MySQL replication exist in the same server software independently. We can make use of these technologies to work together, where all replication within a datacenter will be on Galera while inter-datacenter replication will be on standard MySQL Replication. The slave site can act as a hot-standby site, ready to serve data once the applications are redirected to the backup site. We covered this in a previous blog on MySQL architectures for disaster recovery.

In this blog post, we’ll see how straightforward it is to set up replication between two Galera Clusters (PXC 5.7). Then we’ll look at the more challenging part, that is, handling failures at both node and cluster levels. Failover and failback operations are crucial in order to preserve data integrity across the system.

Cluster Deployment

For the sake of our example, we’ll need at least two clusters and two sites - one for the primary and another one for the secondary. It works similarly to traditional MySQL master-slave replication, but on a bigger scale with three nodes in each site. With ClusterControl, you would achieve this by deploying two separate clusters, one on each site. Then, you would configure asynchronous replication between designed nodes from each cluster.

The following diagram illustrates our default architecture:

We have 6 nodes in total, 3 on the primary site and another 3 on the disaster recovery site. To simplify the node representation, we will use the following notations:

  • Primary site: galera1-P, galera2-P, galera3-P (master)
  • Disaster recovery site: galera1-DR, galera2-DR (slave), galera3-DR

Once the Galera Cluster is deployed, simply pick one node on each site to set up the asynchronous replication link. Take note that ALL Galera nodes must be configured with binary logging and log_slave_updates enabled. Enabling GTID is highly recommended, although not compulsory. On all nodes, configure with the following parameters inside my.cnf:

server_id=40 # this number must be different on every node.
binlog_format=ROW
log_bin = /var/lib/mysql-binlog/binlog
log_slave_updates = ON
gtid_mode = ON
enforce_gtid_consistency = true
expire_logs_days = 7

If you are using ClusterControl, from the web interface, pick Nodes -> the chosen Galera node -> Enable Binary Logging. You might then have to change the server-id on the DR site manually to make sure every node is holding a distinct server-id value.

Then on galera3-P, create the replication user:

mysql> GRANT REPLICATION SLAVE ON *.* to slave@'%' IDENTIFIED BY 'slavepassword';

On galera2-DR, point the slave to the current master, galera3-P:

mysql> CHANGE MASTER TO MASTER_HOST = 'galera3-primary', MASTER_USER = 'slave', MASTER_PASSWORD = 'slavepassword' , MASTER_AUTO_POSITION=1;

Start the replication slave on galera2-DR:

mysql> START SLAVE;

From ClusterControl dashboard, once the replication is established, you should see the DR site has a slave and the Primary site got 3 masters (nodes that produce binary logs):

The deployment is now complete. Applications should send writes to the Primary Site only, as the replication direction goes from Primary Site to DR site. Reads can be sent to both sites, although the DR site might be lagging behind. Assuming that writes only reach the Primary Site, it should not be necessary to set the DR site to read-only (although it can be a good precaution).

This setup will make the primary and disaster recovery site independent of each other, loosely connected with asynchronous replication. One of the Galera nodes in the DR site will be a slave, that replicates from one of the Galera nodes (master) in the primary site. Ensure that both sites are producing binary logs with GTID, and that log_slave_updates is enabled - the updates that come from the asynchronous replication stream will be applied to the other nodes in the cluster.

We now have a system where a cluster failure on the primary site will not affect the backup site. Performance-wise, WAN latency will not impact updates on the active cluster. These are shipped asynchronously to the backup site.

As a side note, it’s also possible to have a dedicated slave instance as replication relay, instead of using one of the Galera nodes as slave.

Node Failover Procedure

In case the current master (galera3-P) fails and the remaining nodes in the Primary Site are still up, the slave on the Disaster Recovery site (galera2-DR) should be directed to any available masters, as shown in the following diagram:

With GTID-based replication, this is peanut. Simply run the following on galera2-DR:

mysql> STOP SLAVE;
mysql> CHANGE MASTER TO MASTER_HOST = 'galera1-P', MASTER_AUTO_POSITION=1;
mysql> START SLAVE;

Verify the slave status with:

mysql> SHOW SLAVE STATUS\G
...
             Slave_IO_Running: Yes
            Slave_SQL_Running: Yes
...            
           Retrieved_Gtid_Set: f66a6152-74d6-ee17-62b0-6117d2e643de:2043395-2047231
            Executed_Gtid_Set: d551839f-74d6-ee17-78f8-c14bd8b1e4ed:1-4,
f66a6152-74d6-ee17-62b0-6117d2e643de:1-2047231
...

Ensure the above values are reporting correctly. The executed GTID set should have 2 sets of GTID at this point, one from all transactions executed on the old master and the other for the new master.

Cluster Failover Procedure

If the primary cluster goes down, crashes, or simply loses connectivity from the application standpoint, the application can be directed to the DR site instantly. No database failover is necessary to continue the operation. If the application has connected to the DR site and starts to write, it is important to ensure no other writes are happening on the Primary Site once the DR site is activated.

The following diagram shows our architecture after application is failed over to the DR site:

Assuming the Primary Site is still down, at this point, there is no replication between sites until we re-configure one of the nodes in the Primary Site once it comes back up.

For clean up purposes, the slave process on the DR site has to be stopped. On galera2-DR, stop replication slave:

mysql> STOP SLAVE;

The failover to the DR site is now considered complete.

Cluster Failback Procedure

To failback to the Primary Site, one of the Galera nodes must become a slave to catch up on changes that happened on the DR site. The procedure would be something like the following:

  1. Pick one node to become a slave in the Primary Site (galera3-P).
  2. Stop all nodes other than the chosen one (galera1-P and galera2-P). Keep the chosen slave up (galera3-P).
  3. Create a backup from the new master (galera2-DR) in the DR site and transfer it over to the chosen slave (galera3-P).
  4. Restore the backup.
  5. Start the replication slave.
  6. Start the remaining Galera node in the Primary Site, with grastate.dat removed.

The below steps can then be performed to fail back the system to its original architecture - Primary is the master and DR is the slave.

1) Shut down all nodes other than the chosen slave:

$ systemctl stop mysql # galera1-P
$ systemctl stop mysql # galera2-P

Or from the ClusterControl interface, simply pick the node from the UI and click "Shutdown Node".

2) Pick a node in the DR site to be the new master (galera2-DR). Create a mysqldump backup with the necessary parameters (for PXC, pxc_strict_mode has to be set other than ENFORCING):

$ mysql -uroot -p -e 'set global pxc_strict_mode = "PERMISSIVE"'
$ mysqldump -uroot -p --all-databases --triggers --routines --events > dump.sql
$ mysql -uroot -p -e 'set global pxc_strict_mode = "ENFORCING"'

3) Transfer the backup to the chosen slave, galera3-P via your preferred remote copy tool:

$ scp dump.sql galera3-primary:~

4) In order to perform RESET MASTER on a Galera node, Galera replication plugin must be turned off. On galera3-P, disable Galera write-set replication temporarily and then restore the dump file in the very same session:

mysql> SET GLOBAL pxc_strict_mode = 'PERMISSIVE';
mysql> SET wsrep_on=OFF;
mysql> RESET MASTER;
mysql> SOURCE /root/dump.sql;

Variable wsrep_on is a session variable. Therefore, we have to perform the restore operation within the same session using SOURCE statement. Otherwise, restoring using standard mysql client would require wsrep_on=OFF or commenting wsrep_provider inside my.cnf set during MySQL startup.

5) Start the replication thread on the chosen slave, galera3-P:

mysql> CHANGE MASTER TO MASTER_HOST = 'galera2-DR', MASTER_USER = 'slave', MASTER_PASSWORD = 'slavepassword', MASTER_AUTO_POSITION = 1;
mysql> START SLAVE;
mysql> SHOW SLAVE STATUS\G

6) Start the remaining of the nodes in the cluster (one node at a time), and force an SST by removing grastate.dat beforehand:

$ rm -Rf /var/lib/mysql/grastate.dat
$ systemctl start mysql

Or from ClusterControl, simply pick the node -> Start Node -> check "Perform an Initial Start".

The above will force other Galera nodes to re-sync with galera3-P through SST and get the most up-to-date data. At this point, the replication direction has switched, from DR to Primary. Write operations are coming to the DR site and the Primary Site has become the replicating site:

From ClusterControl dashboard, you would notice the Primary Site has a slave configured while the DR site are all masters. In ClusterControl, MASTER indicator means all Galera nodes are generating binary logs:

7) Optionally, we can clean up slave's entries on galera2-DR since it's already become a master:

mysql> RESET SLAVE ALL;

8) Once the Primary site catches up, we may switch the database traffic from application back to the primary cluster:

At this point, all writes must go to the Primary Site only. The replication link should be stopped as described under the "Cluster Failover Procedure" section above.

The above mentioned failback steps should be applied when staging back the DR site from the Primary Site:

  • Stop replication between primary site and DR site.
  • Re-slave one of the Galera nodes on the DR site to replicate from the Primary Site.
  • Start replication between both sites.

Once done, the replication direction has gone back to its original configuration, from Primary to DR. Writes operations are coming to the Primary Site and the DR Site is now the replicating site:

Finally, perform some clean ups on the newly promoted master by running "RESET SLAVE ALL".

Advantages

Cluster-to-cluster asynchronous replication comes with a number of advantages:

  • Minimal downtime during database failover operation. Basically, you can redirect the write almost instantly to the slave site, only and only if you can protect writes to not reach the master site (as these writes would not be replicated, and will probably be overwritten when re-syncing from the DR site).
  • No performance impact on the primary site since it is independent from the backup (DR) site. Replication from master to slave is performed asynchronously. The master site generates binary logs, the slave site replicates the events and applies the events at some later time.
  • Disaster recovery site can be used for other purposes, e.g., database backup, binary logs backup and reporting or heavy analytical queries (OLAP). Both sites can be used simultaneously, with exceptions on the replication lag and read-only operations on the slave side.
  • The DR cluster could potentially run on smaller instances in a public cloud environment, as long as they can keep up with the primary cluster. The instances can be upgraded if needed. In certain scenarios, it can save you some costs.
  • You only need one extra site for Disaster Recovery, as opposed to active-active Galera multi-site replication setup, which requires at least 3 sites to operate correctly.

Disadvantages

There are also drawbacks having this setup:

  • There is a chance of missing some data during failover if the slave was behind, since replication is asynchronous. This could be improved with semi-synchronous and multi-threaded slaves replication, albeit there will be another set of challenges waiting (network overhead, replication gap, etc).
  • Despite the failover operation being fairly simple, the failback operation can be tricky and prone to human error. It requires some expertise on switching master/slave role back to the primary site. It's recommended to keep the procedures documented, rehearse the failover/failback operation regularly and use accurate reporting and monitoring tools.
  • There is no built-in failure detection and notification process. You may need to automate and send out notifications to the relevant person once the unwanted event occurs. One good way is to regularly check the slave's status from other available node's point-of-view on the master's site before raising an alarm for the operation team.
  • Pretty costly, as you have to setup a similar number of nodes on the disaster recovery site. This is not black and white, as the cost justification usually comes from the requirements of your business. With some planning, it is possible to maximize usage of database resources at both sites, regardless of the database roles.

MySQL on Docker: How to Monitor MySQL Containers with Prometheus - Part 1 - Deployment on Standalone and Swarm

$
0
0

Monitoring is a concern for containers, as the infrastructure is dynamic. Containers can be routinely created and destroyed, and are ephemeral. So how do you keep track of your MySQL instances running on Docker?

As with any software component, there are many options out there that can be used. We’ll look at Prometheus as a solution built for distributed infrastructure, and works very well with Docker.

This is a two-part blog. In this part 1 blog, we are going to cover the deployment aspect of our MySQL containers with Prometheus and its components, running as standalone Docker containers and Docker Swarm services. In part 2, we will look at the important metrics to monitor from our MySQL containers, as well as integration with the paging and notification systems.

Introduction to Prometheus

Prometheus is a full monitoring and trending system that includes built-in and active scraping, storing, querying, graphing, and alerting based on time series data. Prometheus collects metrics through pull mechanism from configured targets at given intervals, evaluates rule expressions, displays the results, and can trigger alerts if some condition is observed to be true. It supports all the target metrics that we want to measure if one would like to run MySQL as Docker containers. Those metrics include physical hosts metrics, Docker container metrics and MySQL server metrics.

Take a look at the following diagram which illustrates Prometheus architecture (taken from Prometheus official documentation):

We are going to deploy some MySQL containers (standalone and Docker Swarm) complete with a Prometheus server, MySQL exporter (i.e., a Prometheus agent to expose MySQL metrics, that can then be scraped by the Prometheus server) and also Alertmanager to handle alerts based on the collected metrics.

For more details check out the Prometheus documentation. In this example, we are going to use the official Docker images provided by the Prometheus team.

Standalone Docker

Deploying MySQL Containers

Let's run two standalone MySQL servers on Docker to simplify our deployment walkthrough. One container will be using the latest MySQL 8.0 and the other one is MySQL 5.7. Both containers are in the same Docker network called "db_network":

$ docker network create db_network
$ docker run -d \
--name mysql80 \
--publish 3306 \
--network db_network \
--restart unless-stopped \
--env MYSQL_ROOT_PASSWORD=mypassword \
--volume mysql80-datadir:/var/lib/mysql \
mysql:8 \
--default-authentication-plugin=mysql_native_password

MySQL 8 defaults to a new authentication plugin called caching_sha2_password. For compatibility with Prometheus MySQL exporter container, let's use the widely-used mysql_native_password plugin whenever we create a new MySQL user on this server.

For the second MySQL container running 5.7, we execute the following:

$ docker run -d \
--name mysql57 \
--publish 3306 \
--network db_network \
--restart unless-stopped \
--env MYSQL_ROOT_PASSWORD=mypassword \
--volume mysql57-datadir:/var/lib/mysql \
mysql:5.7

Verify if our MySQL servers are running OK:

[root@docker1 mysql]# docker ps | grep mysql
cc3cd3c4022a        mysql:5.7           "docker-entrypoint.s…"   12 minutes ago      Up 12 minutes       0.0.0.0:32770->3306/tcp   mysql57
9b7857c5b6a1        mysql:8             "docker-entrypoint.s…"   14 minutes ago      Up 14 minutes       0.0.0.0:32769->3306/tcp   mysql80

At this point, our architecture is looking something like this:

Let's get started to monitor them.

Exposing Docker Metrics to Prometheus

Docker has built-in support as Prometheus target, where we can use to monitor the Docker engine statistics. We can simply enable it by creating a text file called "daemon.json" inside the Docker host:

$ vim /etc/docker/daemon.json

And add the following lines:

{
  "metrics-addr" : "12.168.55.161:9323",
  "experimental" : true
}

Where 192.168.55.161 is the Docker host primary IP address. Then, restart Docker daemon to load the change:

$ systemctl restart docker

Since we have defined --restart=unless-stopped in our MySQL containers' run command, the containers will be automatically started after Docker is running.

Deploying MySQL Exporter

Before we move further, the mysqld exporter requires a MySQL user to be used for monitoring purposes. On our MySQL containers, create the monitoring user:

$ docker exec -it mysql80 mysql -uroot -p
Enter password:
mysql> CREATE USER 'exporter'@'%' IDENTIFIED BY 'exporterpassword' WITH MAX_USER_CONNECTIONS 3;
mysql> GRANT PROCESS, REPLICATION CLIENT, SELECT ON *.* TO 'exporter'@'%';

Take note that it is recommended to set a max connection limit for the user to avoid overloading the server with monitoring scrapes under heavy load. Repeat the above statements onto the second container, mysql57:

$ docker exec -it mysql57 mysql -uroot -p
Enter password:
mysql> CREATE USER 'exporter'@'%' IDENTIFIED BY 'exporterpassword' WITH MAX_USER_CONNECTIONS 3;
mysql> GRANT PROCESS, REPLICATION CLIENT, SELECT ON *.* TO 'exporter'@'%';

Let's run the mysqld exporter container called "mysql8-exporter" to expose the metrics for our MySQL 8.0 instance as below:

$ docker run -d \
--name mysql80-exporter \
--publish 9104 \
--network db_network \
--restart always \
--env DATA_SOURCE_NAME="exporter:exporterpassword@(mysql80:3306)/" \
prom/mysqld-exporter:latest \
--collect.info_schema.processlist \
--collect.info_schema.innodb_metrics \
--collect.info_schema.tablestats \
--collect.info_schema.tables \
--collect.info_schema.userstats \
--collect.engine_innodb_status

And also another exporter container for our MySQL 5.7 instance:

$ docker run -d \
--name mysql57-exporter \
--publish 9104 \
--network db_network \
--restart always \
-e DATA_SOURCE_NAME="exporter:exporterpassword@(mysql57:3306)/" \
prom/mysqld-exporter:latest \
--collect.info_schema.processlist \
--collect.info_schema.innodb_metrics \
--collect.info_schema.tablestats \
--collect.info_schema.tables \
--collect.info_schema.userstats \
--collect.engine_innodb_status

We enabled a bunch of collector flags for the container to expose the MySQL metrics. You can also enable --collect.slave_status, --collect.slave_hosts if you have a MySQL replication running on containers.

We should be able to retrieve the MySQL metrics via curl from the Docker host directly (port 32771 is the published port assigned automatically by Docker for container mysql80-exporter):

$ curl 127.0.0.1:32771/metrics
...
mysql_info_schema_threads_seconds{state="waiting for lock"} 0
mysql_info_schema_threads_seconds{state="waiting for table flush"} 0
mysql_info_schema_threads_seconds{state="waiting for tables"} 0
mysql_info_schema_threads_seconds{state="waiting on cond"} 0
mysql_info_schema_threads_seconds{state="writing to net"} 0
...
process_virtual_memory_bytes 1.9390464e+07

At this point, our architecture is looking something like this:

We are now good to setup the Prometheus server.

Deploying Prometheus Server

Firstly, create Prometheus configuration file at ~/prometheus.yml and add the following lines:

$ vim ~/prometheus.yml
global:
  scrape_interval:     5s
  scrape_timeout:      3s
  evaluation_interval: 5s

# Our alerting rule files
rule_files:
  - "alert.rules"

# Scrape endpoints
scrape_configs:
  - job_name: 'prometheus'
    static_configs:
      - targets: ['localhost:9090']

  - job_name: 'mysql'
    static_configs:
      - targets: ['mysql57-exporter:9104','mysql80-exporter:9104']

  - job_name: 'docker'
    static_configs:
      - targets: ['192.168.55.161:9323']

From the Prometheus configuration file, we have defined three jobs - "prometheus", "mysql" and "docker". The first one is the job to monitor the Prometheus server itself. The next one is the job to monitor our MySQL containers named "mysql". We define the endpoints on our MySQL exporters on port 9104, which exposed the Prometheus-compatible metrics from the MySQL 8.0 and 5.7 instances respectively. The "alert.rules" is the rule file that we will include later in the next blog post for alerting purposes.

We can then map the configuration with the Prometheus container. We also need to create a Docker volume for Prometheus data for persistency and also expose port 9090 publicly:

$ docker run -d \
--name prometheus-server \
--publish 9090:9090 \
--network db_network \
--restart unless-stopped \
--mount type=volume,src=prometheus-data,target=/prometheus \
--mount type=bind,src="$(pwd)"/prometheus.yml,target=/etc/prometheus/prometheus.yml \
--mount type=bind,src="$(pwd)
prom/prometheus

Now our Prometheus server is already running and can be accessed directly on port 9090 of the Docker host. Open a web browser and go to http://192.168.55.161:9090/ to access the Prometheus web UI. Verify the target status under Status -> Targets and make sure they are all green:

At this point, our container architecture is looking something like this:

Our Prometheus monitoring system for our standalone MySQL containers are now deployed.

Docker Swarm

Deploying a 3-node Galera Cluster

Supposed we want to deploy a three-node Galera Cluster in Docker Swarm, we would have to create 3 different services, each service representing one Galera node. Using this approach, we can keep a static resolvable hostname for our Galera container, together with MySQL exporter containers that will accompany each of them. We will be using MariaDB 10.2 image maintained by the Docker team to run our Galera cluster.

Firstly, create a MySQL configuration file to be used by our Swarm service:

$ vim ~/my.cnf
[mysqld]

default_storage_engine          = InnoDB
binlog_format                   = ROW

innodb_flush_log_at_trx_commit  = 0
innodb_flush_method             = O_DIRECT
innodb_file_per_table           = 1
innodb_autoinc_lock_mode        = 2
innodb_lock_schedule_algorithm  = FCFS # MariaDB >10.1.19 and >10.2.3 only

wsrep_on                        = ON
wsrep_provider                  = /usr/lib/galera/libgalera_smm.so
wsrep_sst_method                = mariabackup

Create a dedicated database network in our Swarm called "db_swarm":

$ docker network create --driver overlay db_swarm

Import our MySQL configuration file into Docker config so we can load it into our Swarm service when we create it later:

$ cat ~/my.cnf | docker config create my-cnf -

Create the first Galera bootstrap service, with "gcomm://" as the cluster address called "galera0". This is a transient service for bootstrapping process only. We will delete this service once we have gotten 3 other Galera services running:

$ docker service create \
--name galera0 \
--replicas 1 \
--hostname galera0 \
--network db_swarm \
--publish 3306 \
--publish 4444 \
--publish 4567 \
--publish 4568 \
--config src=my-cnf,target=/etc/mysql/mariadb.conf.d/my.cnf \
--env MYSQL_ROOT_PASSWORD=mypassword \
--mount type=volume,src=galera0-datadir,dst=/var/lib/mysql \
mariadb:10.2 \
--wsrep_cluster_address=gcomm:// \
--wsrep_sst_auth="root:mypassword" \
--wsrep_node_address=galera0

At this point, our database architecture can be illustrated as below:

Then, repeat the following command for 3 times to create 3 different Galera services. Replace {name} with galera1, galera2 and galera3 respectively:

$ docker service create \
--name {name} \
--replicas 1 \
--hostname {name} \
--network db_swarm \
--publish 3306 \
--publish 4444 \
--publish 4567 \
--publish 4568 \
--config src=my-cnf,target=/etc/mysql/mariadb.conf.d/my.cnf \
--env MYSQL_ROOT_PASSWORD=mypassword \
--mount type=volume,src={name}-datadir,dst=/var/lib/mysql \
mariadb:10.2 \
--wsrep_cluster_address=gcomm://galera0,galera1,galera2,galera3 \
--wsrep_sst_auth="root:mypassword" \
--wsrep_node_address={name}

Verify our current Docker services:

$ docker service ls 
ID                  NAME                MODE                REPLICAS            IMAGE               PORTS
wpcxye3c4e9d        galera0             replicated          1/1                 mariadb:10.2        *:30022->3306/tcp, *:30023->4444/tcp, *:30024-30025->4567-4568/tcp
jsamvxw9tqpw        galera1             replicated          1/1                 mariadb:10.2        *:30026->3306/tcp, *:30027->4444/tcp, *:30028-30029->4567-4568/tcp
otbwnb3ridg0        galera2             replicated          1/1                 mariadb:10.2        *:30030->3306/tcp, *:30031->4444/tcp, *:30032-30033->4567-4568/tcp
5jp9dpv5twy3        galera3             replicated          1/1                 mariadb:10.2        *:30034->3306/tcp, *:30035->4444/tcp, *:30036-30037->4567-4568/tcp

Our architecture is now looking something like this:

We need to remove the Galera bootstrap Swarm service, galera0, to stop it from running because if the container is being rescheduled by Docker Swarm, a new replica will be started with a fresh new volume. We run the risk of data loss because the --wsrep_cluster_address contains "galera0" in the other Galera nodes (or Swarm services). So, let's remove it:

$ docker service rm galera0

At this point, we have our three-node Galera Cluster:

We are now ready to deploy our MySQL exporter and Prometheus Server.

MySQL Exporter Swarm Service

Login to one of the Galera nodes and create the exporter user with proper privileges:

$ docker exec -it {galera1} mysql -uroot -p
Enter password:
mysql> CREATE USER 'exporter'@'%' IDENTIFIED BY 'exporterpassword' WITH MAX_USER_CONNECTIONS 3;
mysql> GRANT PROCESS, REPLICATION CLIENT, SELECT ON *.* TO 'exporter'@'%';

Then, create the exporter service for each of the Galera services (replace {name} with galera1, galera2 and galera3 respectively):

$ docker service create \
--name {name}-exporter \
--network db_swarm \
--replicas 1 \
-p 9104 \
-e DATA_SOURCE_NAME="exporter:exporterpassword@({name}:3306)/" \
prom/mysqld-exporter:latest \
--collect.info_schema.processlist \
--collect.info_schema.innodb_metrics \
--collect.info_schema.tablestats \
--collect.info_schema.tables \
--collect.info_schema.userstats \
--collect.engine_innodb_status

At this point, our architecture is looking something like this with exporter services in the picture:

Prometheus Server Swarm Service

Finally, let's deploy our Prometheus server. Similar to the Galera deployment, we have to prepare the Prometheus configuration file first before importing it into Swarm using Docker config command:

$ vim ~/prometheus.yml
global:
  scrape_interval:     5s
  scrape_timeout:      3s
  evaluation_interval: 5s

# Our alerting rule files
rule_files:
  - "alert.rules"

# Scrape endpoints
scrape_configs:
  - job_name: 'prometheus'
    static_configs:
      - targets: ['localhost:9090']

  - job_name: 'galera'
    static_configs:
      - targets: ['galera1-exporter:9104','galera2-exporter:9104', 'galera3-exporter:9104']

From the Prometheus configuration file, we have defined three jobs - "prometheus" and "galera". The first one is the job to monitor the Prometheus server itself. The next one is the job to monitor our MySQL containers named "galera". We define the endpoints on our MySQL exporters on port 9104, which expose the Prometheus-compatible metrics from the three Galera nodes respectively. The "alert.rules" is the rule file that we will include later in the next blog post for alerting purposes.

Import the configuration file into Docker config to be used with Prometheus container later:

$ cat ~/prometheus.yml | docker config create prometheus-yml -

Let's run the Prometheus server container, and publish port 9090 of all Docker hosts for the Prometheus web UI service:

$ docker service create \
--name prometheus-server \
--publish 9090:9090 \
--network db_swarm \
--replicas 1 \    
--config src=prometheus-yml,target=/etc/prometheus/prometheus.yml \
--mount type=volume,src=prometheus-data,dst=/prometheus \
prom/prometheus

Verify with the Docker service command that we have 3 Galera services, 3 exporter services and 1 Prometheus service:

$ docker service ls
ID                  NAME                MODE                REPLICAS            IMAGE                         PORTS
jsamvxw9tqpw        galera1             replicated          1/1                 mariadb:10.2                  *:30026->3306/tcp, *:30027->4444/tcp, *:30028-30029->4567-4568/tcp
hbh1dtljn535        galera1-exporter    replicated          1/1                 prom/mysqld-exporter:latest   *:30038->9104/tcp
otbwnb3ridg0        galera2             replicated          1/1                 mariadb:10.2                  *:30030->3306/tcp, *:30031->4444/tcp, *:30032-30033->4567-4568/tcp
jq8i77ch5oi3        galera2-exporter    replicated          1/1                 prom/mysqld-exporter:latest   *:30039->9104/tcp
5jp9dpv5twy3        galera3             replicated          1/1                 mariadb:10.2                  *:30034->3306/tcp, *:30035->4444/tcp, *:30036-30037->4567-4568/tcp
10gdkm1ypkav        galera3-exporter    replicated          1/1                 prom/mysqld-exporter:latest   *:30040->9104/tcp
gv9llxrig30e        prometheus-server   replicated          1/1                 prom/prometheus:latest        *:9090->9090/tcp

Now our Prometheus server is already running and can be accessed directly on port 9090 from any Docker node. Open a web browser and go to http://192.168.55.161:9090/ to access the Prometheus web UI. Verify the target status under Status -> Targets and make sure they are all green:

At this point, our Swarm architecture is looking something like this:

To be continued..

We now have our database and monitoring stack deployed on Docker. In part 2 of the blog, we will look into the different MySQL metrics to keep an eye on. We’ll also see how to configure alerting with Prometheus.

Database Security Monitoring for MySQL and MariaDB

$
0
0

Data protection is one of the most significant aspects of administering a database. Depending on the organizational structure, whether you are a developer, sysadmin or DBA, if you are managing the production database, you must monitor data for unauthorized access and usage. The purpose of security monitoring is twofold. One, to identify unauthorised activity on the database. And two, to check if databases ´and their configurations on a company-wide basis are compliant with security policies and standards.

In this article, we will divide monitoring for security in two categories. One will be related to auditing of MySQL and MariaDB databases activities. The second category will be about monitoring your instances for potential security gaps.

Query and connection policy-based monitoring

Continuous auditing is an imperative task for monitoring your database environment. By auditing your database, you can achieve accountability for actions taken or content accessed. Moreover, the audit may include some critical system components, such as the ones associated with financial data to support a precise set of regulations like SOX, or the EU GDPR regulation. Usually, it is achieved by logging information about DB operations on the database to an external log file.

By default, auditing in MySQL or MariaDB is disabled. You and achieve it by installing additional plugins or by capturing all queries with the query_log parameter. The general query log file is a general record of what MySQL is performing. The server records some information to this log when clients connect or disconnect, and it logs each SQL statement received from clients. Due to performance issues and lack of configuration options, the general_log is not a good solution for security audit purposes.

If you use MySQL Enterprise, you can use the MySQL Enterprise Audit plugin which is an extension to the proprietary MySQL version. MySQL Enterprise Audit Plugin plugin is only available with MySQL Enterprise, which is a commercial offering from Oracle. Percona and MariaDB have created their own open source versions of the audit plugin. Lastly, McAfee plugin for MySQL can also be used with various versions of MySQL. In this article, we will focus on the open source plugins, although the Enterprise version from Oracle seems to be the most robust and stable.

Characteristics of MySQL open source audit plugins

While the open source audit plugins do the same job as the Enterprise plugin from Oracle - they produce output with database query and connections - there are some major architectural differences.

MariaDB Audit Plugin – The MariaDB Audit Plugin works with MariaDB, MySQL (as of version 5.5.34 and 10.0.7) and Percona Server. MariaDB started including the Audit Plugin by default from versions 10.0.10 and 5.5.37, and it can be installed in any version from MariaDB 5.5.20. It is the only plugin that supports Oracle MySQL, Percona Server, and MariaDB. It is available on Windows and Linux platform. Versions starting from 1.2 are most stable, and it may be risky to use versions below that in your production environment.

McAfee MySQL Audit Plugin – This plugin does not use MySQL audit API. It was recently updated to support MySQL 5.7. Some tests show that API based plugins may provide better performance but you need to check it with your environment.

Percona Audit Log Plugin – Percona provides an open source auditing solution that installs with Percona Server 5.5.37+ and 5.6.17+ as part of the installation process. Comparing to other open source plugins, this plugin has more reach output features as it outputs XML, JSON and to syslog.

As it has some internal hooks to the server to be feature-compatible with Oracle’s plugin, it is not available as a standalone plugin for other versions of MySQL.

Plugin installation based on MariaDB audit extension

The installation of open source MySQL plugins is quite similar for MariaDB, Percona, and McAfee versions.
Percona and MariaDB add their plugins as part of the default server binaries, so there is no need to download plugins separately. The Percona version only officially supports it’s own fork of MySQL so there is no direct download from the vendor's website ( if you want to use this plugin with MySQL, you will have to obtain the plugin from a Percona server package). If you would like to use the MariaDB plugin with other forks of MySQL, then you can find it from https://downloads.mariadb.com/Audit-Plugin/MariaDB-Audit-Plugin/. The McAfee plugin is available at https://github.com/mcafee/mysql-audit/wiki/Installation.

Before you start the plugin installation, you can check if the plugin is present in the system. The dynamic plugin (doesn’t require instance restart) location can be checked with:

SHOW GLOBAL VARIABLES LIKE 'plugin_dir';

+---------------+--------------------------+
| Variable_name | Value                    |
+---------------+--------------------------+
| plugin_dir    | /usr/lib64/mysql/plugin/ |
+---------------+--------------------------+

Check the directory returned at the filesystem level to make sure you have a copy of the plugin library. If you do not have server_audit.so or server_audit.dll inside of /usr/lib64/mysql/plugin/, then more likely your MariaDB version is not supported and should upgrade it to latest version..

The syntax to install the MariaDB plugin is:

INSTALL SONAME 'server_audit';

To check installed plugins you need to run:

SHOW PLUGINS;
MariaDB [(none)]> show plugins;
+-------------------------------+----------+--------------------+--------------------+---------+
| Name                          | Status   | Type               | Library            | License |
+-------------------------------+----------+--------------------+--------------------+---------+
| binlog                        | ACTIVE   | STORAGE ENGINE     | NULL               | GPL     |
| mysql_native_password         | ACTIVE   | AUTHENTICATION     | NULL               | GPL     |
| mysql_old_password            | ACTIVE   | AUTHENTICATION     | NULL               | GPL     |
| wsrep                         | ACTIVE   | STORAGE ENGINE     | NULL               | GPL     |
| MRG_MyISAM                    | ACTIVE   | STORAGE ENGINE     | NULL               | GPL     |
| MEMORY                        | ACTIVE   | STORAGE ENGINE     | NULL               | GPL     |
| CSV                           | ACTIVE   | STORAGE ENGINE     | NULL               | GPL     |
| MyISAM                        | ACTIVE   | STORAGE ENGINE     | NULL               | GPL     |
| CLIENT_STATISTICS             | ACTIVE   | INFORMATION SCHEMA | NULL               | GPL     |
| INDEX_STATISTICS              | ACTIVE   | INFORMATION SCHEMA | NULL               | GPL     |
| TABLE_STATISTICS              | ACTIVE   | INFORMATION SCHEMA | NULL               | GPL     |
| USER_STATISTICS               | ACTIVE   | INFORMATION SCHEMA | NULL               | GPL     |
| PERFORMANCE_SCHEMA            | ACTIVE   | STORAGE ENGINE     | NULL               | GPL     |
| InnoDB                        | ACTIVE   | STORAGE ENGINE     | NULL               | GPL     |
| INNODB_TRX                    | ACTIVE   | INFORMATION SCHEMA | NULL               | GPL     |
| INNODB_LOCKS                  | ACTIVE   | INFORMATION SCHEMA | NULL               | GPL     |
| INNODB_LOCK_WAITS             | ACTIVE   | INFORMATION SCHEMA | NULL               | GPL     |
| INNODB_CMP                    | ACTIVE   | INFORMATION SCHEMA | NULL               | GPL     |
...
| INNODB_MUTEXES                | ACTIVE   | INFORMATION SCHEMA | NULL               | GPL     |
| INNODB_SYS_SEMAPHORE_WAITS    | ACTIVE   | INFORMATION SCHEMA | NULL               | GPL     |
| INNODB_TABLESPACES_ENCRYPTION | ACTIVE   | INFORMATION SCHEMA | NULL               | BSD     |
| INNODB_TABLESPACES_SCRUBBING  | ACTIVE   | INFORMATION SCHEMA | NULL               | BSD     |
| Aria                          | ACTIVE   | STORAGE ENGINE     | NULL               | GPL     |
| SEQUENCE                      | ACTIVE   | STORAGE ENGINE     | NULL               | GPL     |
| user_variables                | ACTIVE   | INFORMATION SCHEMA | NULL               | GPL     |
| FEEDBACK                      | DISABLED | INFORMATION SCHEMA | NULL               | GPL     |
| partition                     | ACTIVE   | STORAGE ENGINE     | NULL               | GPL     |
| rpl_semi_sync_master          | ACTIVE   | REPLICATION        | semisync_master.so | GPL     |
| rpl_semi_sync_slave           | ACTIVE   | REPLICATION        | semisync_slave.so  | GPL     |
| SERVER_AUDIT                  | ACTIVE   | AUDIT              | server_audit.so    | GPL     |
+-------------------------------+----------+--------------------+--------------------+---------+

If you need additional information, check the PLUGINS table in the information_schema database which contains more detailed information.

Another way to install the plugin is to enable the plugin in my.cnf and restart the instance. An example of a basic audit plugin configuration from MariaDB could be :

server_audit_events=CONNECT
server_audit_file_path=/var/log/mysql/audit.log
server_audit_file_rotate_size=1073741824
server_audit_file_rotations=8
server_audit_logging=ON
server_audit_incl_users=
server_audit_excl_users=
server_audit_output_type=FILE
server_audit_query_log_limit=1024

Above setting should be placed in my.cnf. Audit plugin will create file /var/log/mysql/audit.log which will rotate on size 1GB and there will be eight rotations until the file is overwritten. The file will contain only information about connections.

Currently, there are sixteen settings which you can use to adjust the MariaDB audit plugin.

server_audit_events
server_audit_excl_users
server_audit_file_path
server_audit_file_rotate_now
server_audit_file_rotate_size
server_audit_file_rotations
server_audit_incl_users
server_audit_loc_info
server_audit_logging
server_audit_mode
server_audit_output_type
Server_audit_query_log_limit
server_audit_syslog_facility
server_audit_syslog_ident
server_audit_syslog_info
server_audit_syslog_priority

Among them, you can find options to include or exclude users, set different logging events (CONNECT or QUERY) and switch between file and syslog.

To make sure the plugin will be enabled upon server startup, you have to set
plugin_load=server_audit=server_audit.so in your my.cnf settings. Such configuration can be additionally protected by server_audit=FORCE_PLUS_PERMANENT which will disable the plugin uninstall option.

UNINSTALL PLUGIN server_audit;

ERROR 1702 (HY000):
Plugin 'server_audit' is force_plus_permanent and can not be unloaded

Here is some sample entries produced by MariaDB audit plugin:

20180817 20:00:01,slave,cmon,cmon,31,0,DISCONNECT,information_schema,,0
20180817 20:47:01,slave,cmon,cmon,17,0,DISCONNECT,information_schema,,0
20180817 20:47:02,slave,cmon,cmon,19,0,DISCONNECT,information_schema,,0
20180817 20:47:02,slave,cmon,cmon,18,0,DISCONNECT,information_schema,,0
20180819 17:19:19,slave,cmon,cmon,12,0,CONNECT,information_schema,,0
20180819 17:19:19,slave,root,localhost,13,0,FAILED_CONNECT,,,1045
20180819 17:19:19,slave,root,localhost,13,0,DISCONNECT,,,0
20180819 17:19:20,slave,cmon,cmon,14,0,CONNECT,mysql,,0
20180819 17:19:20,slave,cmon,cmon,14,0,DISCONNECT,mysql,,0
20180819 17:19:21,slave,cmon,cmon,15,0,CONNECT,information_schema,,0
20180819 17:19:21,slave,cmon,cmon,16,0,CONNECT,information_schema,,0
20180819 19:00:01,slave,cmon,cmon,17,0,CONNECT,information_schema,,0
20180819 19:00:01,slave,cmon,cmon,17,0,DISCONNECT,information_schema,,0

Schema changes report

If you need to track only DDL changes, you can use the ClusterControl Operational Report on Schema Change. The Schema Change Detection Report shows any DDL changes on your database. This functionality requires an additional parameter in ClusterControl configuration file. If this is not set you will see the following information: schema_change_detection_address is not set in /etc/cmon.d/cmon_1.cnf. Once that is in place an example output may be like below:

It can be set up with a schedule, and the reports emailed to recipients.

ClusterControl: Schedule Operational Report

MySQL Database Security Assessment

Package upgrade check

First, we will start with security checks. Being up-to-date with MySQL patches will help reduce risks associated with known vulnerabilities present in the MySQL server. You can keep your environment up-to-date by using the vendors’ package repository. Based on this information you can build your own reports, or use tools like ClusterControl to verify your environment and alert you on possible updates.

ClusterControl Upgrade Report gathers information from the operating system and compares them to packages available in the repository. The report is divided into four sections; upgrade summary, database packages, security packages, and other packages. You can quickly compare what you have installed on your system and find a recommended upgrade or patch.

ClusterControl: Upgrade Report
ClusterControl: Upgrade Report details

To compare them manually you can run

SHOW VARIABLES WHERE variable_name LIKE "version";

With security bulletins like:
https://www.oracle.com/technetwork/topics/security/alerts-086861.html
https://nvd.nist.gov/view/vuln/search-results?adv_search=true&cves=on&cpe_vendor=cpe%3a%2f%3aoracle&cpe_produ
https://www.percona.com/doc/percona-server/LATEST/release-notes/release-notes_index.html
https://downloads.mariadb.org/mariadb/+releases/
https://www.cvedetails.com/vulnerability-list/vendor_id-12010/Mariadb.html
https://www.cvedetails.com/vulnerability-list/vendor_id-13000/Percona.html

Or vendor repositories:

On Debian

sudo apt list mysql-server

On RHEL/Centos

yum list | grep -i mariadb-server

Accounts without password

Blank passwords allow a user to login without using a password. MySQL used to come with a set of pre-created users, some of which can connect to the database without password or, even worse, anonymous users. Fortunately, this has changed in MySQL 5.7. Finally, it comes only with a root account that uses the password you choose at installation time.

For each row returned from the audit procedure, set a password:

SELECT User,host
FROM mysql.user
WHERE authentication_string='';

Additionally, you can install a password validation plugin and implement a more secure policy:

INSTALL PLUGIN validate_password SONAME 'validate_password.so';

SHOW VARIABLES LIKE 'default_password_lifetime';
SHOW VARIABLES LIKE 'validate_password%';

An good start can be:

plugin-load=validate_password.so
validate-password=FORCE_PLUS_PERMANENT
validate_password_length=14
validate_password_mixed_case_count=1
validate_password_number_count=1
validate_password_special_char_count=1
validate_password_policy=MEDIUM

Of course, these settings will depend on your business needs.

Remote access monitoring

Avoiding the use of wildcards within hostnames helps control the specific locations from which a given user may connect to and interact with the database.

You should make sure that every user can connect to MySQL only from specific hosts. You can always define several entries for the same user, this should help to reduce a need for wildcards.

Execute the following SQL statement to assess this recommendation (make sure no rows are returned):

SELECT user, host FROM mysql.user WHERE host = '%';

Test database

The default MySQL installation comes with an unused database called test and the test database is available to every user, especially to the anonymous users. Such users can create tables and write to them. This can potentially become a problem on its own - and writes would add some overhead and reduce database performance. It is recommended that the test database is dropped. To determine if the test database is present, run:

SHOW DATABASES LIKE 'test';

If you notice that the test database is present, this could be that mysql_secure_installation script which drops the test database (as well as other security-related activities) was not executed.

LOAD DATA INFILE

If both server and client has the ability to run LOAD DATA LOCAL INFILE, a client will be able to load data from a local file to a remote MySQL server. The local_infile parameter dictates whether files located on the MySQL client's computer can be loaded or selected via LOAD DATA INFILE or SELECT local_file.

This, potentially, can help to read files the client has access to - for example, on an application server, one could access any data that the HTTP server has access to. To avoid it, you need to set local-infile=0 in my.cnf.

Execute the following SQL statement and ensure the Value field is set to OFF:

SHOW VARIABLES WHERE Variable_name = 'local_infile';

Monitor for non-encrypted tablespaces

Starting from MySQL 5.7.11, InnoDB supports data encryption for tables stored in file-per-table tablespaces. This feature provides at-rest encryption for physical tablespace data files. To examine if your tables have been encrypted run:

mysql> SELECT TABLE_SCHEMA, TABLE_NAME, CREATE_OPTIONS FROM INFORMATION_SCHEMA.TABLES
       WHERE CREATE_OPTIONS LIKE '%ENCRYPTION="Y"%';

+--------------+------------+----------------+
| TABLE_SCHEMA | TABLE_NAME | CREATE_OPTIONS |
+--------------+------------+----------------+
| test         | t1         | ENCRYPTION="Y" |
+--------------+------------+----------------+

As a part of the encryption, you should also consider encryption of the binary log. The MySQL server writes plenty of information to binary logs.

Encryption connection validation

In some setups, the database should not be accessible through the network if every connection is managed locally, through the Unix socket. In such cases, you can add the ‘skip-networking’ variable in my.cnf. Skip-networking prevents MySQL from using any TCP/IP connection, and only Unix socket would be possible on Linux.

However this is rather rare situation as it is common to access MySQL over the network. You then need to monitor that your connections are encrypted. MySQL supports SSL as a means to encrypting traffic both between MySQL servers (replication) and between MySQL servers and clients. If you use Galera cluster, similar features are available - both intra-cluster communication and connections with clients can be encrypted using SSL. To check if you use SSL encryption run the following queries:

SHOW variables WHERE variable_name = 'have_ssl'; 
select ssl_verify_server_cert from mysql.slave_master_info;

That’s it for now. This is not a complete list, do let us know if there are any other checks that you are doing today on your production databases.

How ClusterControl Monitors your Database Servers and Clusters Agentlessly

$
0
0

ClusterControl’s agentless approach allows sysadmins and DBAs to monitoring their databases without having to install agent software on each monitored system. Monitoring is implemented using a remote data collector that uses the SSH protocol.

But first, let’s clarify the scope and meaning of monitoring within our context here. Monitoring comes after data trending - the metrics collection and storing process - which allows the monitoring system to process the collected data to produce justification for tuning, alerting, as well as displaying trending data for reporting.

Generally, ClusterControl performs its monitoring, alerting and trending duties by using the following three ways:

  • SSH - Host metrics collection (process, load balancers stats, resource usage and consumption etc) using SSH library.
  • Database client - Database metrics collection (status, queries, variables, usage etc) using the respective database client library.
  • Advisor - Mini programs written using ClusterControl DSL and running within ClusterControl itself, for monitoring, tuning and alerting purposes.

Some description of the above - SSH stands for Secure Shell, a secure network protocol which is used by most of the Linux-based servers for remote administration. ClusterControl Controller, or CMON, is the backend service performing automation, management, monitoring and scheduling tasks, built on top of C++.

ClusterControl DSL (Domain Specific Language) allows you to extend the functionality of your ClusterControl platform by creating Advisors, Auto Tuners, or "Mini Programs". The DSL syntax is based on JavaScript, with extensions to provide access to ClusterControl internal data structures and functions. The DSL allows you to execute SQL statements, run shell commands/programs across all your cluster hosts, and retrieve results to be processed for advisors/alerts or any other actions.

Monitoring Tools

All of the prerequisite tools will be met by the installer script or will be automatically installed by ClusterControl during the database deployment stage, or if the required file/binary/package does not exist on the target server before executing a job. Generally speaking, ClusterControl monitoring duty only requires OpenSSH server package on the monitored hosts. ClusterControl uses libssh client library to collect host metrics for the monitored hosts - CPU, memory, disk, network, IO, process, etc. OpenSSH client package is required on the ClusterControl host only for setting up passwordless SSH and debugging purposes. Other SSH implementations like Dropbear and TinySSH are not supported.

When gathering the database stats and metrics, ClusterControl Controller (CMON) connects to the database server directly via database client libraries - libmysqlclient (MySQL/MariaDB and ProxySQL), libpq (PostgreSQL) and libmongocxx (MongoDB). That is why it's crucial to setup proper privileges for ClusterControl server from database servers perspective. For MySQL-based clusters, ClusterControl requires database user "cmon" while for other databases, any username can be used for monitoring, as long as it is granted with super-user privileges. Most of the time, ClusterControl will setup the required privileges (or use the specified database user) automatically during the cluster import or cluster deployment stage.

For load balancers, ClusterControl requires the following tools:

  • Maxadmin on the MariaDB MaxScale server.
  • netcat and/or socat on the HAProxy server to connect to HAProxy socket file and retrieve the monitoring data.
  • ProxySQL requires mysql client on the ProxySQL server.

The following diagram illustrates both host and database monitoring processes executed by ClusterControl using libssh and database client libraries:

Although monitoring threads do not need database client packages to be installed on the monitored host, it's highly recommended to have them for management purposes. For example, MySQL client package comes with mysql, mysqldump, mysqlbinlog and mysqladmin programs which will be used by ClusterControl when performing backups and point-in-time recovery.

Monitoring Methods

For host and load balancer stats collection, ClusterControl executes this task via SSH with super-user privilege. Therefore, passwordless SSH with super-user privilege is vital, to allow ClusterControl to run the necessary commands remotely with proper escalation. With this pull approach, there are a couple of advantages as compared to other mechanisms:

  • Agentless - There is no need for agent to be installed, configured and maintained.
  • Unifying the management and monitoring configuration - SSH can be used to pull monitoring metrics or push management jobs on the target nodes.
  • Simplify the deployment - The only requirement is proper passwordless SSH setup and that's it. SSH is also very secure and encrypted.
  • Centralized setup - One ClusterControl server can manage multiple servers and clusters, provided it has sufficient resources.

However, there are also drawbacks with the pull mechanism:

  • The monitoring data is accurate only from ClusterControl perspective. For example, if there is a network glitch and ClusterControl loses communication to the monitored host, the sampling will be skipped until the next available cycle.
  • For high granularity monitoring, there will be network overhead due to increase sampling rate where ClusterControl needs to establish more connections to every target hosts.
  • ClusterControl will keep on attempting to re-establish connection to the target node, because it has no agent to do this on its behalf.
  • Redundant data sampling if you have more than one ClusterControl server monitoring a cluster, since each ClusterControl server has to pull the monitoring data for itself.

For MySQL query monitoring, ClusterControl monitors the queries in two different ways:

  1. Queries are retrieved from PERFORMANCE_SCHEMA, by querying the schema on the database node via SSH.
  2. If PERFORMANCE_SCHEMA is disabled or unavailable, ClusterControl will parse the content of the Slow Query Log via SSH.

If Performance Schema is enabled, ClusterControl will use it to look for the slow queries. Otherwise, ClusterControl will parse the content of the MySQL slow query log (via slow_query_log=ON dynamic variable) based on the following flow:

  1. Start slow log (during MySQL runtime).
  2. Run it for a short period of time (a second or couple of seconds).
  3. Stop log.
  4. Parse log.
  5. Truncate log (new log file).
  6. Go to 1.

The collected queries are hashed, calculated and digested (normalize, average, count, sort) and then stored in ClusterControl CMON database. Take note that for this sampling method, there is a slight chance some queries will not be captured, especially during “stop log, parse log, truncate log” parts. You can enable Performance Schema if this is not an option.

If you are using the Slow Query log, only queries that exceed the Long Query Time will be listed here. If the data is not populated correctly and you believe that there should be something in there, it could be:

  • ClusterControl did not collect enough queries to summarize and populate data. Try to lower the Long Query Time.
  • You have configured Slow Query Log configuration options in the my.cnf of MySQL server, and Override Local Query is turned off. If you really want to use the value you defined inside my.cnf, probably you have to lower the long_query_time value so ClusterControl can calculate a more accurate result.
  • You have another ClusterControl node pulling the Slow Query log as well (in case you have a standby ClusterControl server). Only allow one ClusterControl server to do this job.

For more details (including how to enable the PERFORMANCE_SCHEMA), see this blog post, How to use the ClusterControl Query Monitor for MySQL, MariaDB and Percona Server.

For PostgreSQL query monitoring, ClusterControl requires pg_stat_statements module, to track execution statistics of all SQL statements. It populates the pg_stat_statements views and functions when displaying the queries in the UI (under Query Monitor tab).

Intervals and Timeouts

ClusterControl Controller (cmon) is a multi-threaded process. By default, ClusterControl Controller sampling thread connects to each monitored host once and maintain persistent connection until the host drops or disconnects it when sampling host stats. It may establish more connections depending on the jobs assigned to the host, since most of the management jobs run in their own thread. For example, cluster recovery runs on the recovery thread, Advisor execution runs on a cron-thread, as well as process monitoring which runs on process collector thread.

ClusterControl monitoring thread performs the following sampling operations in the following interval:

  • MySQL query/status metrics: every second
  • Process collection (/proc): every 10 seconds
  • Server detection: every 10 seconds
  • Host metrics (/proc, /sys): every 30 seconds (configurable via host_stats_collection_interval)
  • Database metrics (PostgreSQL and MongoDB only): every 30 seconds (configurable via db_stats_collection_interval)
  • Database schema metrics: every 3 hours (configurable via db_schema_stats_collection_interval)
  • Load balancer metrics: every 15 seconds (configurable via lb_stats_collection_interval)

The imperative scripts (Advisors) can make use of SSH and database client libraries that come with CMON with the following restrictions:

  • 5 seconds of hard limit for SSH execution,
  • 10 seconds of default limit for database connection, configurable via net_read_timeout, net_write_timeout, connect_timeout in CMON configuration file,
  • 60 seconds of total script execution time limit before CMON ungracefully aborts it.

Advisors can be created, compiled, tested and scheduled directly from ClusterControl UI, under Manage -> Developer Studio. The following screenshot shows an example of an Advisor to extract top 10 queries from PERFORMANCE_SCHEMA:

The execution of advisors is depending if it is activated and the scheduling time in cron format:

The results of the execution are displayed under Performance -> Advisors, as shown in the following screenshot:

For more information on what Advisors being provided by default, check out our Developer Studio product page.

For short-interval monitoring data like MySQL queries and status, data are stored directly into CMON database. While for long-interval monitoring data like weekly/monthly/yearly data points are aggregated every 60 seconds and stored in memory for 10 minutes. These behaviours are not configurable due to the architecture design.

ClusterControl
Single Console for Your Entire Database Infrastructure
Find out what else is new in ClusterControl

Parameters

There are plethora of parameters you can configure for ClusterControl to suit your monitoring and alerting policy. Most of them are configurable through ClusterControl UI -> pick a cluster -> Settings. The "Settings" tab provide many options to configure alerts, thresholds, notifications, graphs layout, database counters, query monitoring and so on. For example, warning and critical thresholds can be configured as follows:

There are also "Runtime Configuration" page, a summarized list of the active ClusterControl Controller (CMON) runtime configuration parameters:

There are more than 170 ClusterControl Controller configuration options in total and some of the advanced settings can be configured to finely tune your monitoring and alerting policy. To list out some of them:

  • monitor_cpu_temperature
  • swap_warning
  • swap_critical
  • redobuffer_warning
  • redobuffer_critical
  • indexmemory_warning
  • indexmemory_critical
  • datamemory_warning
  • datamemory_critical
  • tablespace_warning
  • tablespace_critical
  • redolog_warning
  • redolog_critical
  • max_replication_lag
  • long_query_time
  • log_queries_not_using_indexes
  • query_monitor_use_local_settings
  • enable_query_monitor
  • enable_query_monitor_auto_purge_ps

The parameters listed in the "Runtime Configuration" page can be changed either by using the UI or CMON configuration file located at /etc/cmon.d/cmon_X.cnf, where X is the cluster ID. You can list out all of the supported configuration options for CMON by using the following command:

$ cmon --help-config

The same output is also available in the documentation page, ClusterControl Controller Configuration Options.

Final Thoughts

We hope this blog has given you a good understanding of how ClusterControl monitors your database servers and clusters agentlessly. We’ll be shortly announcing some significant new features in the next version of ClusterControl so stay tuned!

New Webinar - Free Monitoring (on Steroids) for MySQL, MariaDB, PostgreSQL and MongoDB

$
0
0

Monitoring is essential for operations teams to ensure that databases are up and running. However, as databases are increasingly being deployed in distributed topologies based on replication or clustering, what does it mean to our monitoring infrastructure? Is it ok to monitor individual components of a database cluster, or do we need a more holistic systems approach? Can we rely on SELECT 1 as health check when determining whether a database is up or down? Do we need high-resolution time-series charts of status counters? Are there ways to predict problems before they actually become one?

In this webinar, we will discuss how to effectively monitor distributed database clusters or replication setups. We’ll look at different types of monitoring infrastructures, from on-prem to cloud and from agent-based to agentless. Then we’ll dive into the different monitoring features available in the free ClusterControl Community Edition - from time-series charts of metrics, dashboards, and queries to performance advisors.

If you would like to centralize the monitoring of your open source databases and achieve this at zero cost, please join us on September 25!

Date, Time & Registration

Europe/MEA/APAC

Tuesday, September 25th at 09:00 BST / 10:00 CEST (Germany, France, Sweden)

Register Now

North America/LatAm

Tuesday, September 25th at 09:00 Pacific Time (US) / 12:00 Eastern Time (US)

Register Now

Agenda

  • Requirements for monitoring distributed database systems
  • Cloud-based vs On-prem monitoring solutions
  • Agent-based vs Agentless monitoring
  • Deep-dive into ClusterControl Community Edition
    • Architecture
    • Metrics Collection
    • Trending
    • Dashboards
    • Queries
    • Performance Advisors
    • Other features available to Community users

Speaker

Bartlomiej Oles is a MySQL and Oracle DBA, with over 15 years experience in managing highly available production systems at IBM, Nordea Bank, Acxiom, Lufthansa, and other Fortune 500 companies. In the past five years, his focus has been on building and applying automation tools to manage multi-datacenter database environments.

We look forward to “seeing” you there!

How to Deploy a Production-Ready MySQL or MariaDB Galera Cluster using ClusterControl

$
0
0

Deploying a database cluster is not rocket science - there are many how-to’s on how to do that. But how do you know what you just deployed is production-ready? Manual deployments can also be tedious and repetitive. Depending on the number of nodes in the cluster, the deployment steps may be time-consuming and error-prone. Configuration management tools like Puppet, Chef and Ansible are popular in deploying infrastructure, but for stateful database clusters, you need to perform significant scripting to handle deployment of the whole database HA stack. Moreover, the chosen template/module/cookbook/role has to be meticulously tested before you can trust it as part of your infrastructure automation. Version changes require the scripts to be updated and tested again.

The good news is that ClusterControl automates deployments of the entire stack - and for free as well! We’ve deployed thousands of production clusters, and take a number of precautions to ensure they are production-ready Different topologies are supported, from master-slave replication to Galera, NDB and InnoDB cluster, with different database proxies on top.

A high availability stack, deployed through ClusterControl, consists of three layers:

  • Database layer (e.g., Galera Cluster)
  • Reverse proxy layer (e.g., HAProxy or ProxySQL)
  • Keepalived layer, which, with use of Virtual IP, ensures high availability of the proxy layer

In this blog, we are going to show you how to deploy a production-grade Galera Cluster complete with load balancers for high availability setup. The complete setup consists of 6 hosts:

  • 1 host - ClusterControl (deployment, monitoring, management server)
  • 3 hosts - MySQL Galera Cluster
  • 2 hosts - Reverse proxies act as load balancers in front of the cluster.

The following diagram illustrates our end result once deployment is complete:

Prerequisites

ClusterControl must reside on an independant node which is not part of the cluster. Download ClusterControl, and the page will generate a license unique for you and show the steps to install ClusterControl:

$ wget -O install-cc https://severalnines.com/scripts/install-cc
$ chmod +x install-cc
$ ./install-cc # as root or sudo user

Follow the instructions where you will be guided with setting up MySQL server, MySQL root password on the ClusterControl node, cmon password for ClusterControl usage and so on. You should get the following line once the installation has completed:

Determining network interfaces. This may take a couple of minutes. Do NOT press any key.
Public/external IP => http://{public_IP}/clustercontrol
Installation successful. If you want to uninstall ClusterControl then run install-cc --uninstall.

Then, on the ClusterControl server, generate an SSH key which we will use to setup the passwordless SSH later on. You can use any user in the system but it must have the ability to perform super-user operations (sudoer). In this example, we picked the root user:

$ whoami
root
$ ssh-keygen -t rsa

Set up passwordless SSH to all nodes that you would like to monitor/manage via ClusterControl. In this case, we will set this up on all nodes in the stack (including ClusterControl node itself). On ClusterControl node, run the following commands and specify the root password when prompted:

$ ssh-copy-id root@192.168.55.160 # clustercontrol
$ ssh-copy-id root@192.168.55.161 # galera1
$ ssh-copy-id root@192.168.55.162 # galera2
$ ssh-copy-id root@192.168.55.163 # galera3
$ ssh-copy-id root@192.168.55.181 # proxy1
$ ssh-copy-id root@192.168.55.182 # proxy2

You can then verify if it's working by running the following command on ClusterControl node:

$ ssh root@192.168.55.161 "ls /root"

Make sure you are able to see the result of the command above without the need to enter password.

Deploying the Cluster

ClusterControl supports all vendors for Galera Cluster (Codership, Percona and MariaDB). There are some minor differences which may influence your decision for choosing the vendor. If you would like to learn about the differences between them, check out our previous blog post - Galera Cluster Comparison - Codership vs Percona vs MariaDB.

For production deployment, a three-node Galera Cluster is the minimum you should have. You can always scale it out later once the cluster is deployed, manually or via ClusterControl. We’ll open our ClusterControl UI at https://192.168.55.160/clustercontrol and create the first admin user. Then, go to the top menu and click Deploy -> MySQL Galera and you will be presented with the following dialog:

There are two steps, the first one is the "General & SSH Settings". Here we need to configure the SSH user that ClusterControl should use to connect to the database nodes, together with the path to the SSH key (as generated under Prerequisite section) as well as the SSH port of the database nodes. ClusterControl presumes all database nodes are configured with the same SSH user, key and port. Next, give the cluster a name, in this case we will use "MySQL Galera Cluster 5.7". This value can be changed later on. Then select the options to instruct ClusterControl to install the required software, disable the firewall and also disable the security enhancement module on the particular Linux distribution. All of these are recommended to be toggled on to maximize the potential of successful deployment.

Click Continue and you will be presented with the following dialog:

In the next step, we need to configure the database servers - vendor, version, datadir, port, etc - which are pretty self-explanatory. "Configuration Template" is the template filename under /usr/share/cmon/templates of the ClusterControl node. "Repository" is how ClusterControl should configure the repository on the database node. By default, it will use the vendor repository and install the latest version provided by the repository. However, in some cases, the user might have a pre-existing repository mirrored from the original repository due to security policy restriction. Nevertheless, ClusterControl supports most of them, as described in the user guide, under Repository.

Lastly, add the IP address or hostname (must be a valid FQDN) of the database nodes. You will see a green tick icon on the left of the node, indicating ClusterControl was able to connect to the node via passwordless SSH. You are now good to go. Click Deploy to start the deployment. This may take 15 to 20 minutes to complete. You can monitor the deployment progress under Activity (top menu) -> Jobs -> Create Cluster:

Once the deployment completed, at this point, our architecture can be illustrated as below:

Deploying the Load Balancers

In Galera Cluster, all nodes are equal - each node holds the same role and same dataset. Therefore, there is no failover within the cluster if a node fails. Only the application side requires failover, to skip the inoperational nodes while the cluster is partitioned. Therefore, it's highly recommended to place load balancers on top of a Galera Cluster to:

  • Unify the multiple database endpoints to a single endpoint (load balancer host or virtual IP address as the endpoint).
  • Balance the database connections between the backend database servers.
  • Perform health checks and only forward the database connections to healthy nodes.
  • Redirect/rewrite/block offending (badly written) queries before they hit the database servers.

There are three main choices of reverse proxies for Galera Cluster - HAProxy, MariaDB MaxScale or ProxySQL - all can be installed and configured automatically by ClusterControl. In this deployment, we picked ProxySQL because it checks all the above plus it understands the MySQL protocol of the backend servers.

In this architecture, we want to use two ProxySQL servers to eliminate any single-point-of-failure (SPOF) to the database tier, which will be tied together using a floating virtual IP address. We’ll explain this in the next section. One node will act as the active proxy and the other one as hot-standby. Whichever node that holds the virtual IP address at a given time is the active node.

To deploy the first ProxySQL server, simply go to the cluster action menu (right-side of the summary bar) and click on Add Load Balancer -> ProxySQL -> Deploy ProxySQL and you will see the following:

Again, most of the fields are self-explanatory. In the "Database User" section, ProxySQL acts as a gateway through which your application connects to the database. The application authenticates against ProxySQL, therefore you have to add all of the users from all the backend MySQL nodes, along with their passwords, into ProxySQL. From ClusterControl, you can either create a new user to be used by the application - you can decide on its name, password, access to which databases are granted and what MySQL privileges that user will have. Such user will be created on both MySQL and ProxySQL side. Second option, more suitable for existing infrastructures, is to use the existing database users. You need to pass username and password, and such user will be created only on ProxySQL.

The last section, "Implicit Transaction", ClusterControl will configure ProxySQL to send all of the traffic to the master if we started transaction with SET autocommit=0. Otherwise, if you use BEGIN or START TRANSACTION to create a transaction, ClusterControl will configure read/write split in the query rules. This is to ensure ProxySQL will handle transactions correctly. If you have no idea how your application does this, you can pick the latter.

Repeat the same configuration for the second ProxySQL node, except the "Server Address" value which is 192.168.55.182. Once done, both nodes will be listed under "Nodes" tab -> ProxySQL where you can monitor and manage them directly from the UI:

At this point, our architecture is now looking like this:

If you would like to learn more about ProxySQL, do check out this tutorial - Database Load Balancing for MySQL and MariaDB with ProxySQL - Tutorial.

Deploying the Virtual IP Address

The final part is the virtual IP address. Without it, our load balancers (reverse proxies) would be the weak link as they would be a single-point of failure - unless the application has the ability to automatically redirect failed database connections to another load balancer. Nevertheless, it's good practice to unify them both using virtual IP address and simplify the connection endpoint to the database layer.

From ClusterControl UI -> Add Load Balancer -> Keepalived -> Deploy Keepalived and select the two ProxySQL hosts that we have deployed:

Also, specify the virtual IP address and the network interface to bind the IP address. The network interface must exist on both ProxySQL nodes. Once deployed, you should see the following green checks in the summary bar of the cluster:

At this point, our architecture can be illustrated as below:

Our database cluster is now ready for production usage. You can import your existing database into it or create a fresh new database. You can use the Schemas and Users Management feature if the trial license hasn't expired.

To understand how ClusterControl configures Keepalived, check out this blog post, How ClusterControl Configures Virtual IP and What to Expect During Failover.

Connecting to the Database Cluster

From the application and client standpoint, they need to connect to 192.168.55.180 on port 6033 which is the virtual IP address floating on top of the load balancers. For example, the Wordpress database configuration will be something like this:

/** The name of the database for WordPress */
define( 'DB_NAME', 'wp_myblog' );

/** MySQL database username */
define( 'DB_USER', 'wp_myblog' );

/** MySQL database password */
define( 'DB_PASSWORD', 'mysecr3t' );

/** MySQL hostname - virtual IP address with ProxySQL load-balanced port*/
define( 'DB_HOST', '192.168.55.180:6033' );

If you would like to access the database cluster directly, bypassing the load balancer, you can just connect to port 3306 of the database hosts. This is usually required by the DBA staff for administration, management, and troubleshooting. With ClusterControl, most of these operations can be performed directly from the user interface.

Final Thoughts

As shown above, deploying a database cluster is no longer a difficult task. Once deployed, there a full suite of free monitoring features as well as commercial features for backup management, failover/recovery and others. Fast deployment of different types of cluster/replication topologies can be useful when evaluating high availability database solutions, and how they fit to your particular environment.

Become a ClusterControl DBA: Performance and Health Monitoring

$
0
0

In the previous two blog posts we covered both deploying the four types of clustering/replication (MySQL/Galera, MySQL Replication, MongoDB & PostgreSQL) and managing/monitoring your existing databases and clusters. So, after reading these two first blog posts you were able to add your 20 existing replication setups to ClusterControl, expand them and additionally deployed two new Galera clusters while doing a ton of other things. Or maybe you deployed MongoDB and/or PostgreSQL systems. So now, how do you keep them healthy?

That’s exactly what this blog post is about: how to leverage ClusterControl performance monitoring and advisors functionality to keep your MySQL, MongoDB and/or PostgreSQL databases and clusters healthy. So how is this done in ClusterControl?

Database Cluster List

The most important information can already be found in the cluster list: as long as there are no alarms and no hosts are shown to be down, everything is functioning fine. An alarm is raised if a certain condition is met, e.g. host is swapping, and brings to your attention the issue you should investigate. That means that alarms not only are raised during an outage but also to allow you to proactively manage your databases.

Suppose you would log into ClusterControl and see a cluster listing like this, you will definitely have something to investigate: one node is down in the Galera cluster for example and every cluster has various alarms:

Once you click on one of the alarms, you will go to a detailed page on all alarms of the cluster. The alarm details will explain the issue and in most cases also advise the action to resolve the issue.

You can set up your own alarms by creating custom expressions, but that has been deprecated in favor of our new Developer Studio that allows you to write custom Javascripts and execute these as Advisors. We will get back to this topic later in this post.

Cluster Overview - Dashboards

When opening up the cluster overview, we can immediately see the most important performance metrics for the cluster in the tabs. This overview may differ per cluster type as, for instance, Galera has different performance metrics to watch than traditional MySQL, PostgreSQL or MongoDB.

Both the default overview and the pre-selected tabs are customizable. By clicking on Overview -> Dash Settings you are given a dialogue that allows you to define the dashboard:

By pressing the plus sign you can add and define your own metrics to graph the dashboard. In our case we will define a new dashboard featuring the Galera specific send and receive queue average:

This new dashboard should give us good insight in the average queue length of our Galera cluster.

Once you have pressed save, the new dashboard will become available for this cluster:

Similarly you can do this for PostgreSQL as well, for example we can monitor the shared blocks hit versus blocks read:

So as you can see, it is relatively easy to customize your own (default) dashboard.

Cluster Overview - Query Monitor

The Query Monitor tab is available for both MySQL and PostgreSQL based setups and consists out of three dashboards: Top Queries, Running Queries and Query Outliers.

In the Running Queries dashboard, you will find all current queries that are running. This is basically the equivalent of SHOW FULL PROCESSLIST statement in MySQL database.

Top Queries and Query Outliers both rely on the input of the slow query log or Performance Schema. Using Performance Schema is always recommended and will be used automatically if enabled. Otherwise, ClusterControl will use the MySQL slow query log to capture the running queries. To prevent ClusterControl from being too intrusive and the slow query log to grow too large, ClusterControl will sample the slow query log by turning it on and off. This loop is by default set to 1 second capturing and the long_query_time is set to 0.5 seconds. If you wish to change these settings for your cluster, you can change this via Settings -> Query Monitor.

Top Queries will, like the name says, show the top queries that were sampled. You can sort them on various columns: for instance the frequency, average execution time, total execution time or standard deviation time:

You can get more details about the query by selecting it and this will present the query execution plan (if available) and optimization hints/advisories. The Query Outliers is similar to the Top Queries but then allows you to filter the queries per host and compare them in time.

ClusterControl
Single Console for Your Entire Database Infrastructure
Find out what else is new in ClusterControl

Cluster Overview - Operations

Similar to the PostgreSQL and MySQL systems the MongoDB clusters have the Operations overview and is similar to the MySQL's Running Queries. This overview is similar to issuing the db.currentOp() command within MongoDB.

Cluster Overview - Performance

MySQL/Galera

The performance tab is probably the best place to find the overall performance and health of your clusters. For MySQL and Galera it consists of an Overview page, the Advisors, status/variables overviews, the Schema Analyzer and the Transaction log.

The Overview page will give you a graph overview of the most important metrics in your cluster. This is, obviously, different per cluster type. Eight metrics have been set by default, but you can easily set your own - up to 20 graphs if needed:

The Advisors is one of the key features of ClusterControl: the Advisors are scripted checks that can be run on demand. The advisors can evaluate almost any fact known about the host and/or cluster and give its opinion on the health of the host and/or cluster and even can give advice on how to resolve issues or improve your hosts!

The best part is yet to come: you can create your own checks in the Developer Studio (ClusterControl -> Manage -> Developer Studio), run them on a regular interval and use them again in the Advisors section. We blogged about this new feature earlier this year.

We will skip the status/variables overview of MySQL and Galera as this is useful for reference but not for this blog post: it is good enough that you know it is here.

Now suppose your database is growing but you want to know how fast it grew in the past week. You can actually keep track of the growth of both data and index sizes from right within ClusterControl:

And next to the total growth on disk it can also report back the top 25 largest schemas.

Another important feature is the Schema Analyzer within ClusterControl:

ClusterControl will analyze your schemas and look for redundant indexes, MyISAM tables and tables without a primary key. Of course it is entirely up to you to keep a table without a primary key because some application might have created it this way, but at least it is great to get the advice here for free. The Schema Analyzer even recommends the necessary ALTER statement to fix the problem.

PostgreSQL

For PostgreSQL the Advisors, DB Status and DB Variables can be found here:

MongoDB

For MongoDB the Mongo Stats and performance overview can be found under the Performance tab. The Mongo Stats is an overview of the output of mongostat and the Performance overview gives a good graphical overview of the MongoDB opcounters:

Final Thoughts

We showed you how to keep your eyeballs on the most important monitoring and health checking features of ClusterControl. Obviously this is only the beginning of the journey as we will soon start another blog series about the Developer Studio capabilities and how you can make most of your own checks. Also keep in mind that our support for MongoDB and PostgreSQL is not as extensive as our MySQL toolset, but we are continuously improving on this.

You may ask yourself why we have skipped over the performance monitoring and health checks of HAProxy, ProxySQL and MaxScale. We did that deliberately as the blog series covered only deployments of clusters up till now and not the deployment of HA components. So that’s the subject we'll cover next time.


Custom Graphs to Monitor your MySQL, MariaDB, MongoDB and PostgreSQL Systems - ClusterControl Tips & Tricks

$
0
0

Graphs are important, as they are your window onto your monitored systems. ClusterControl comes with a predefined set of graphs for you to analyze, these are built on top of the metric sampling done by the controller. Those are designed to give you, at first glance, as much information as possible about the state of your database cluster. You might have your own set of metrics you’d like to monitor though. Therefore ClusterControl allows you to customize the graphs available in the cluster overview section and in the Nodes -> DB Performance tab. Multiple metrics can be overlaid on the same graph.

Cluster Overview tab

Let’s take a look at the cluster overview - it shows the most important information aggregated under different tabs.

Cluster Overview Graphs

You can see graphs like “Cluster Load” and “Galera - Flow Ctrl” along with couple of others. If this is not enough for you, you can click on “Dash Settings” and then pick “Create Board” option. From there, you can also manage existing graphs - you can edit a graph by double-clicking on it, you can also delete it from the tab list.

Dashboard Settings
Dashboard Settings

When you decide to create a new graph, you’ll be presented with an option to pick metrics that you’d like to monitor. Let’s assume we are interested in monitoring temporary objects - tables, files and tables on disk. We just need to pick all three metrics we want to follow and add them to our new graph.

New Board 1
New Board 1

Next, pick some name for our new graph and pick a scale. Most of the time you want scale to be linear but in some rare cases, like when you mix metrics containing large and small values, you may want to use logarithmic scale instead.

New Board 2
New Board 2

Finally, you can pick if your template should be presented as a default graph. If you tick this option, this is the graph you will see by default when you enter the “Overview” tab.

Once we save the new graph, you can enjoy the result:

New Board 3
New Board 3

Node Overview tab

In addition to the graphs on our cluster, we can also use this functionality on each of our nodes independently. On the cluster, if we go to the “Nodes” section and select some of them, we can see an overview of it, with metrics of the operating system:

Node Overview Graphs

As we can see, we have eight graphs with information about CPU usage, Network usage, Disk space, RAM usage, Disk utilization, Disk IOPS, Swap space and Network errors, which we can use as a starting point for troubleshooting on our nodes.

ClusterControl
Single Console for Your Entire Database Infrastructure
Find out what else is new in ClusterControl

DB Performance tab

When you take a look at the node and then follow into DB Performance tab, you’ll be presented with a default of eight different metrics. You can change them or add new ones. To do that, you need to use “Choose Graph” button:

DB Performance Graphs

You’ll be presented with a new window, that allows you to configure the layout and the metrics graphed.

DB Performance Graphs Settings

Here you can pick the layout - two or three columns of graphs and number of graphs - up to 20. Then, you may want to modify which metrics you’d want to see plotted - use drop-down dialog boxes to pick whatever metric you’d like to add. Once you are ready, save the graphs and enjoy your new metrics.

We can also use the Operational Reports feature of ClusterControl, where we will obtain the graphs and the report of our cluster and nodes in a HTML report, that can be accessed through the ClusterControl UI, or schedule it to be sent by email periodically.

These graphs help us to have a complete picture of the state and behavior of our databases.

How to Monitor Multiple MySQL Instances Running on the Same Machine - ClusterControl Tips & Tricks

$
0
0

Requires ClusterControl 1.6 or later. Applies to MySQL based instances/clusters.

On some occasions, you might want to run multiple instances of MySQL on a single machine. You might want to give different users access to their own MySQL servers that they manage themselves, or you might want to test a new MySQL release while keeping an existing production setup undisturbed.

It is possible to use a different MySQL server binary per instance, or use the same binary for multiple instances (or a combination of the two approaches). For example, you might run a server from MySQL 5.6 and one from MySQL 5.7, to see how the different versions handle a certain workload. Or you might run multiple instances of the latest MySQL version, each managing a different set of databases.

Whether or not you use distinct server binaries, each instance that you run must be configured with unique values for several operating parameters. This eliminates the potential for conflict between instances. You can use MySQL Sandbox to create multiple MySQL instances. Or you can use mysqld_multi available in MySQL to start or stop any number of separate mysqld processes running on different TCP/IP ports and UNIX sockets.

In this blog post, we’ll show you how to configure ClusterControl to monitor multiple MySQL instances running on one host.

ClusterControl Limitation

At the time of writing, ClusterControl does not support monitoring of multiple instances on one host per cluster/server group. It assumes the following best practices:

  • Only one MySQL instance per host (physical server or virtual machine).
  • MySQL data redundancy should be configured on N+1 server.
  • All MySQL instances are running with uniform configuration across the cluster/server group, e.g., listening port, error log, datadir, basedir, socket are identical.

With regards to the points mentioned above, ClusterControl assumes that in a cluster/server group:

  • MySQL instances are configured uniformly across a cluster; same port, the same location of logs, base/data directory and other critical configurations.
  • It monitors, manages and deploys only one MySQL instance per host.
  • MySQL client must be installed on the host and available on the executable path for the corresponding OS user.
  • The MySQL is bound to an IP address reachable by ClusterControl node.
  • It keeps monitoring the host statistics e.g CPU/RAM/disk/network for each MySQL instance individually. In an environment with multiple instances per host, you should expect redundant host statistics since it monitors the same host multiple times.

With the above assumptions, the following ClusterControl features do not work for a host with multiple instances:

Backup - Percona Xtrabackup does not support multiple instances per host and mysqldump executed by ClusterControl only connects to the default socket.

Process management - ClusterControl uses the standard ‘pgrep -f mysqld_safe’ to check if MySQL is running on that host. With multiple MySQL instances, this is a false positive approach. As such, automatic recovery for node/cluster won’t work.

Configuration management - ClusterControl provisions the standard MySQL configuration directory. It usually resides under /etc/ and /etc/mysql.

Workaround

Monitoring multiple MySQL instances on a machine is still possible with ClusterControl with a simple workaround. Each MySQL instance must be treated as a single entity per server group.

In this example, we have 3 MySQL instances on a single host created with MySQL Sandbox:

ClusterControl monitoring multiple instances on same host

We created our MySQL instances using the following commands:

$ su - sandbox
$ make_multiple_sandbox mysql-5.7.23-linux-glibc2.12-x86_64.tar.gz

By default, MySQL Sandbox creates mysql instances that listen to 127.0.0.1. It is necessary to configure each node appropriately to make them listen to all available IP addresses. Here is the summary of our MySQL instances in the host:

[sandbox@master multi_msb_mysql-5_7_23]$ cat default_connection.json 
{
"node1":  
    {
        "host":     "master",
        "port":     "15024",
        "socket":   "/tmp/mysql_sandbox15024.sock",
        "username": "msandbox@127.%",
        "password": "msandbox"
    }
,
"node2":  
    {
        "host":     "master",
        "port":     "15025",
        "socket":   "/tmp/mysql_sandbox15025.sock",
        "username": "msandbox@127.%",
        "password": "msandbox"
    }
,
"node3":  
    {
        "host":     "master",
        "port":     "15026",
        "socket":   "/tmp/mysql_sandbox15026.sock",
        "username": "msandbox@127.%",
        "password": "msandbox"
    }
}

Next step is to modify the configuration of the newly created instances. Go to my.cnf for each of them and hash bind_address variable:

[sandbox@master multi_msb_mysql-5_7_23]$ ps -ef | grep mysqld_safe
sandbox  13086     1  0 08:58 pts/0    00:00:00 /bin/sh bin/mysqld_safe --defaults-file=/home/sandbox/sandboxes/multi_msb_mysql-5_7_23/node1/my.sandbox.cnf
sandbox  13805     1  0 08:58 pts/0    00:00:00 /bin/sh bin/mysqld_safe --defaults-file=/home/sandbox/sandboxes/multi_msb_mysql-5_7_23/node2/my.sandbox.cnf
sandbox  14065     1  0 08:58 pts/0    00:00:00 /bin/sh bin/mysqld_safe --defaults-file=/home/sandbox/sandboxes/multi_msb_mysql-5_7_23/node3/my.sandbox.cnf
[sandbox@master multi_msb_mysql-5_7_23]$ vi my.cnf
#bind_address = 127.0.0.1

Then install mysql on your master node and restart all instances using restart_all script.

[sandbox@master multi_msb_mysql-5_7_23]$ yum install mysql
[sandbox@master multi_msb_mysql-5_7_23]$ ./restart_all  
# executing "stop" on /home/sandbox/sandboxes/multi_msb_mysql-5_7_23
executing "stop" on node 1
executing "stop" on node 2
executing "stop" on node 3
# executing "start" on /home/sandbox/sandboxes/multi_msb_mysql-5_7_23
executing "start" on node 1
. sandbox server started
executing "start" on node 2
. sandbox server started
executing "start" on node 3
. sandbox server started

From ClusterControl, we need to perform ‘Import’ for each instance as we need to isolate them in a different group to make it work.

ClusterControl import existing server

For node1, enter the following information in ClusterControl > Import:

ClusterControl import existing server

Make sure to put proper ports (different for different instances) and host (same for all instances).

You can monitor the progress by clicking on the Activity/Jobs icon in the top menu.

ClusterControl import existing server details

You will see node1 in the UI once ClusterControl finishes the job. Repeat the same steps to add another two nodes with port 15025 and 15026. You should see something like the below once they are added:

ClusterControl Dashboard

There you go. We just added our existing MySQL instances into ClusterControl for monitoring. Happy monitoring!

PS.: To get started with ClusterControl, click here!

Become a ClusterControl DBA: Operational Reports for MySQL, MariaDB, PostgreSQL & MongoDB

$
0
0

The majority of DBA’s perform health checks on their databases every now and then. Usually, it would happen on a daily or weekly basis. We previously discussed why such checks are important and what they should include.

To make sure your systems are in a good shape, you’d need to go through quite a lot of information - host statistics, MySQL statistics, workload statistics, state of backups, database packages, logs and so forth. Such data should be available in every properly monitored environment, although sometimes it is scattered across multiple locations - you may have one tool to monitor MySQL state, another tool to collect system statistics, maybe a set of scripts, e.g., to check the state of your backups. This makes health checks much more time-consuming than they should be - the DBA has to put together the different pieces to understand the state of the system.

Integrated tools like ClusterControl have an advantage that all of the bits are located in the same place (or in the same application). It still does not mean they are located next to each other - they may be located in different sections of the UI and a DBA may have to spend some time clicking through the UI to reach all the interesting data.

The whole idea behind creating Operational Reports is to put all of the most important data into a single document, which can be quickly reviewed to get an understanding of the state of the databases.

Operational Reports are available from the menu Side Menu -> Operational Reports:

Once you go there, you’ll be presented with a list of reports created manually or automatically, based on a predefined schedule:

If you want to create a new report manually, you’ll use the 'Create' option. Pick the type of report, cluster name (for per-cluster report), email recipients (optional - if you want the report to be delivered to you), and you’re pretty much done:

The reports can also be scheduled to be created on a regular basis:

At this time, 5 types of reports are available:

  • Availability report - All clusters.
  • Backup report - All clusters.
  • Schema change report - MySQL/MariaDB-based cluster only.
  • Daily system report - Per cluster.
  • Package upgrade report - Per cluster.

Availability Report

Availability reports focuses on, well, availability. It includes three sections. First, availability summary:

You can see information about availability statistics of your databases, the cluster type, total uptime and downtime, current state of the cluster and when that state last changed.

Another section gives more details on availability for every cluster. The screenshot below only shows one of the database cluster:

We can see when a node switched state and what the transition was. It’s a nice place to check if there were any recent problems with the cluster. Similar data is shown in the third section of this report, where you can go through the history of changes in cluster state.

Backup Report

The second type of the report is one covering backups of all clusters. It contains two sections - backup summary and backup details, where the former basically gives you a short summary of when the last backup was created, if it completed successfully or failed, backup verification status, success rate and retention period:

ClusterControl also provides examples of backup policy if it finds any of the monitored database cluster running without any scheduled backup or delayed slave configured. Next are the backup details:

You can also check the list of backups executed on the cluster with their state, type and size within the specified interval. This is as close you can get to be certain that backups work correctly without running a full recovery test. We definitely recommend that such tests are performed every now and then. Good news is ClusterControl supports MySQL-based restoration and verification on a standalone host under Backup -> Restore Backup.

Daily System Report

This type of report contains detailed information about a particular cluster. It starts with a summary of different alerts which are related to the cluster:

Next section is about the state of the nodes that are part of the cluster:

You have a list of the nodes in the cluster, their type, role (master or slave), status of the node, uptime and the OS.

Another section of the report is the backup summary, same as we discussed above. Next one presents a summary of top queries in the cluster:

Finally, we see a “Node status overview” in which you’ll be presented with graphs related to OS and MySQL metrics for each node.

As you can see, we have here graphs covering all of the aspects of the load on the host - CPU, memory, network, disk, CPU load and disk free. This is enough to get an idea whether anything weird happened recently or not. You can also see some details about MySQL workload - how many queries were executed, which type of query, how the data was accessed (via which handler)? This, on the other hand, should be enough to pick most of the issues on MySQL side. What you want to look at are all spikes and dips that you haven’t seen in the past. Maybe a new query has been added to the mix and, as a result, handler_read_rnd_next skyrocketed? Maybe there was an increase of CPU load and a high number of connections might point to increased load on MySQL, but also to some kind of contention. An unexpected pattern might be good to investigate, so you know what is going on.

Package Upgrade Report

This report gives a summary of packages available for upgrade by the repository manager on the monitored hosts. For an accurate reporting, ensure you always use stable and trusted repositories on every host. In some undesirable occasions, the monitored hosts could be configured with an outdated repository after an upgrade (e.g, every MariaDB major version uses different repository), incomplete internal repository (e.g, partial mirrored from the upstream) or bleeding edge repository (commonly for unstable nightly-build packages).

The first section is the upgrade summary:

It summarizes the total number of packages available for upgrade as well as the related managed service for the cluster like load balancer, virtual IP address and arbitrator. Next, ClusterControl provides a detailed package list, grouped by package type for every host:

This report provides the available version and can greatly help us plan our maintenance window efficiently. For critical upgrades like security and database packages, we could prioritize it over non-critical upgrades, which could be consolidated with other less priority maintenance windows.

Schema Change Report

This report compares the selected MySQL/MariaDB database changes in table structure which happened between two different generated reports. In the MySQL/MariaDB older versions, DDL operation is a non-atomic operation (pre 8.0) and requires full table copy (pre 5.6 for most operations) - blocking other transactions until it completes. Schema changes could become a huge pain once your tables get a significant amount of data and must be carefully planned especially in a clustered setup. In a multi-tiered development environment, we have seen many cases where developers silently modify the table structure, resulting in significant impact to query performance.

In order for ClusterControl to produce an accurate report, special options must be configured inside CMON configuration file for the respective cluster:

  • schema_change_detection_address - Checks will be executed using SHOW TABLES/SHOW CREATE TABLE to determine if the schema has changed. The checks are executed on the address specified and is of the format HOSTNAME:PORT. The schema_change_detection_databases must also be set. A differential of a changed table is created (using diff).
  • schema_change_detection_databases - Comma separated list of databases to monitor for schema changes. If empty, no checks are made.

In this example, we would like to monitor schema changes for database "myapp" and "sbtest" on our MariaDB Cluster with cluster ID 27. Pick one of the database nodes as the value of schema_change_detection_address. For MySQL replication, this should be the master host, or any slave host that holds the databases (in case partial replication is active). Then, inside /etc/cmon.d/cmon_27.cnf, add the two following lines:

schema_change_detection_address=10.0.0.30:3306
schema_change_detection_databases=myapp,sbtest

Restart CMON service to load the change:

$ systemctl restart cmon

For the first and foremost report, ClusterControl only returns the result of metadata collection, similar to below:

With the first report as the baseline, the subsequent reports will return the output that we are expecting for:

Take note only new tables or changed tables are printed in the report. The first report is only for metadata collection for comparison in the subsequent rounds, thus we have to run it for at least twice to see the difference.

With this report, you can now gather the database structure footprints and understand how your database has evolved across time.

Final Thoughts

Operational report is a comprehensive way to understand the state of your database infrastructure. It is built for both operational or managerial staff, and can be very useful in analysing your database operations. The reports can be generated in-place or can be delivered to you via email, which make things conveniently easy if you have a reporting silo.

We’d love to hear your feedback on anything else you’d like to have included in the report, what’s missing and what is not needed.

Introducing Agent-Based Database Monitoring with ClusterControl 1.7

$
0
0

We are excited to announce the 1.7 release of ClusterControl - the only management system you’ll ever need to take control of your open source database infrastructure!

ClusterControl 1.7 introduces new exciting agent-based monitoring features for MySQL, Galera Cluster, PostgreSQL & ProxySQL, security and cloud scaling features ... and more!

Release Highlights

Monitoring & Alerting

  • Agent-based monitoring with Prometheus
  • New performance dashboards for MySQL, Galera Cluster, PostgreSQL & ProxySQL

Security & Compliance

  • Enable/disable Audit Logging on your MariaDB databases
  • Enable policy-based monitoring and logging of connection and query activity

Deployment & Scaling

  • Automatically launch cloud instances and add nodes to your cloud deployments

Additional Highlights

  • Support for MariaDB v10.3

View the ClusterControl ChangeLog for all the details!

ClusterControl
Single Console for Your Entire Database Infrastructure
Find out what else is new in ClusterControl

View Release Details and Resources

Release Details

Monitoring & Alerting

Agent-based monitoring with Prometheus

ClusterControl was originally designed to address modern, highly distributed database setups based on replication or clustering. It provides a systems view of all the components of a distributed cluster, including load balancers, and maintains a logical topology view of the cluster.

So far we’d gone the agentless monitoring route with ClusterControl, and although we love the simplicity of not having to install or manage agents on the monitored database hosts, an agent-based approach can provide higher resolution of monitoring data and has certain advantages in terms of security.

With that in mind, we’re happy to introduce agent-based monitoring as a new feature added in ClusterControl 1.7!

It makes use of Prometheus, a full monitoring and trending system that includes built-in and active scraping and storing of metrics based on time series data. One Prometheus server can be used to monitor multiple clusters. ClusterControl takes care of installing and maintaining Prometheus as well as exporters on the monitored hosts.

Users can now enable their database clusters to use Prometheus exporters to collect metrics on their nodes and hosts, thus avoiding excessive SSH activity for monitoring and metrics collections and use SSH connectivity only for management operations.

Monitoring & Alerting

New performance dashboards for MySQL, Galera Cluster, PostgreSQL & ProxySQL

ClusterControl users now have access to a set of new dashboards that have Prometheus as the data source with its flexible query language and multi-dimensional data model, where time series data is identified by metric name and key/value pairs. This allows for greater accuracy and customization options while monitoring your database clusters.

The new dashboards include:

  • Cross Server Graphs
  • System Overview
  • MySQL Overview, Replication, Performance Schema & InnoDB Metrics
  • Galera Cluster Overview & Graphs
  • PostgreSQL Overview
  • ProxySQL Overview

Security & Compliance

Audit Log for MariaDB

Continuous auditing is an imperative task for monitoring your database environment. By auditing your database, you can achieve accountability for actions taken or content accessed. Moreover, the audit may include some critical system components, such as the ones associated with financial data to support a precise set of regulations like SOX, or the EU GDPR regulation. Usually, it is achieved by logging information about DB operations on the database to an external log file.

With ClusterControl 1.7 users can now enable a plugin that will log all of their MariaDB database connections or queries to a file for further review; it also introduces support for version 10.3 of MariaDB.

Additional New Functionalities

View the ClusterControl ChangeLog for all the details!

Download ClusterControl today!

Happy Clustering!

New White Paper on State-of-the-Art Database Management: ClusterControl - The Guide

$
0
0

Today we’re happy to announce the availability of our first white paper on ClusterControl, the only management system you’ll ever need to automate and manage your open source database infrastructure!

Download ClusterControl - The Guide!

Most organizations have databases to manage, and experience the headaches that come with that: managing performance, monitoring uptime, automatically recovering from failures, scaling, backups, security and disaster recovery. Organizations build and buy numerous tools and utilities for that purpose.

ClusterControl differs from the usual approach of trying to bolt together performance monitoring, automatic failover and backup management tools by combining – in one product – everything you need to deploy and operate mission-critical databases in production. It automates the entire database environment, and ultimately delivers an agile, modern and highly available data platform based on open source.

All-in-one management software - the ClusterControl features set:

Since the inception of Severalnines, we have made it our mission to provide market-leading solutions to help organisations achieve optimal efficiency and availability of their open source database infrastructures.

With ClusterControl, as it stands today, we are proud to say: mission accomplished!

Our flagship product is an integrated deployment, monitoring, and management automation system for open source databases, which provides holistic, real-time control of your database operations in an easy and intuitive experience, incorporating the best practices learned from thousands of customer deployments in a comprehensive system that helps you manage your databases safely and reliably.

Whether you’re a MySQL, MariaDB, PostgreSQL or MongoDB user (or a combination of these), ClusterControl has you covered.

Deploying, monitoring and managing highly available open source database clusters is not a small feat and requires either just as highly specialised database administration (DBA) skills … or professional tools and systems that non-DBA users can wield in order to build and maintain such systems, though these typically come with an equally high learning curve.

The idea and concept for ClusterControl was born out of that conundrum that most organisations face when it comes to running highly available database environments.

It is the only solution on the market today that provides that intuitive, easy to use system with the full set of tools required to manage such complex database environments end-to-end, whether one is a DBA or not.

The aim of this Guide is to make the case for comprehensive open source database management and the need for cluster management software. And explains in a just as comprehensive fashion why ClusterControl is the only management system you will ever need to run highly available open source database infrastructures.

Download ClusterControl - The Guide!

Viewing all 365 articles
Browse latest View live